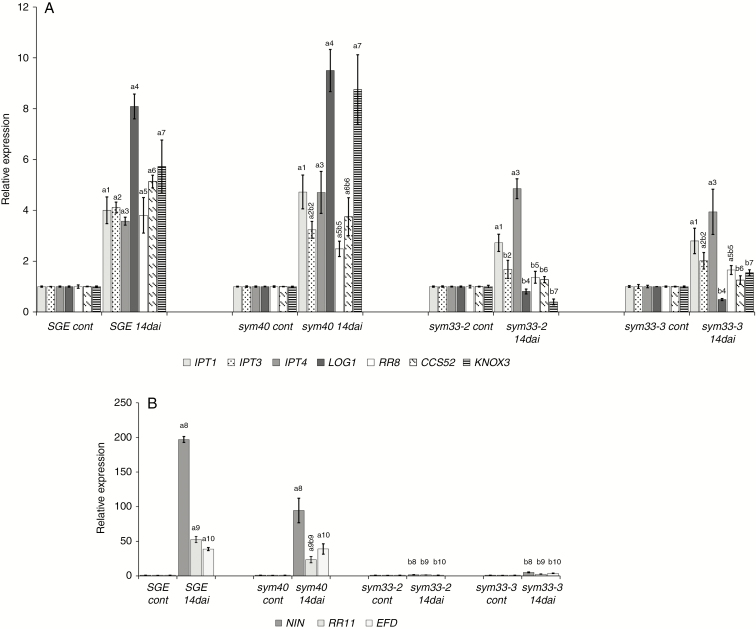
Fig. 9.
Expression pattern of cytokinin metabolic and regulatory genes IPT1, IPT3, IPT4, LOG1, RR8, CCS52A and KNOX3 (A), and NIN, RR11 and EFD (B) in pea wild type and sym33-2, sym33-3 and sym40 mutants 2 weeks after inoculation (14 dai). Transcript levels of genes were normalized against pea Ubiquitin and Actin genes. For each gene, the transcript level in non-inoculated roots of the wild type or mutants was set to 1 (control), and the level in nodules of the inoculated wild type or mutants was calculated relative to the control values. The graphs show the results of three independent experiments. The error bars represent the s.e.m. of three repeats. To conduct one biological repeat, the fragments of non-inoculated main roots or nodules from 3–4 plants were collected and used to isolate RNA. Pairwise comparisons were made using Dunn’s test, and the CLD algorithm was performed to summarize the sets of groups that differed significantly for each gene (groups are shown with different letters on the histogram). Kruskal–Wallis one-way analysis of variance showed significant differences in expression of genes IPT3 [H(d.f. = 3) = 9.59, P = 0.022], LOG1 [H(d.f. = 3) = 10.17, P = 0.017], RR8 [H(d.f. = 3) = 10.42, P = 0.015], KNOX3 [H(d.f. = 3) = 11.18, P = 0.011], NIN [H(d.f. = 3) = 11.36, P = 0.0099], EFD [H(d.f. = 3) = 9.56, P = 0.023] and RR11 [H(d.f. = 3) = 10.51, P = 0.015] depending on the type of plant.

