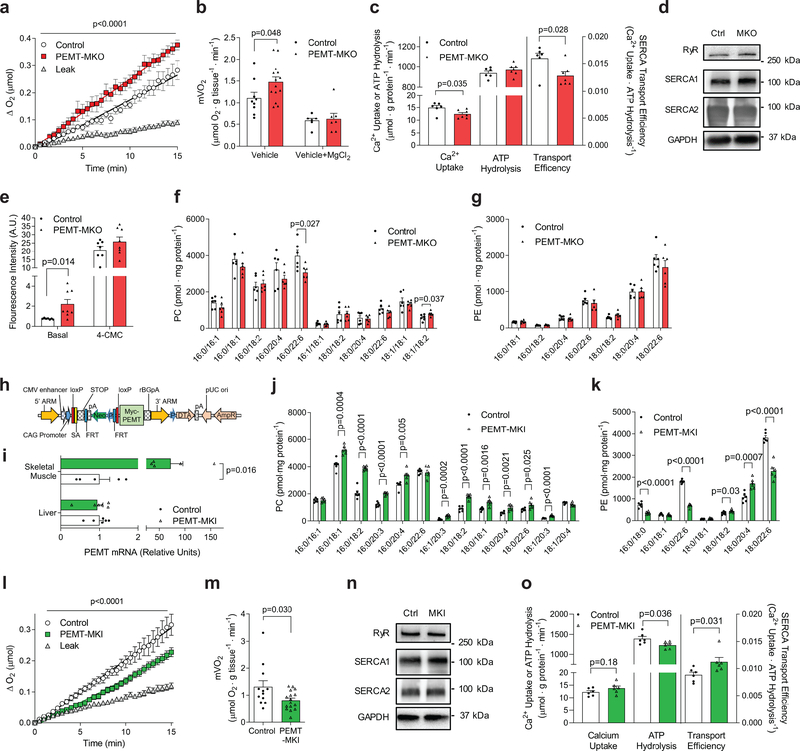
Figure 4.
Skeletal muscle PEMT alters SR phospholipids to regulate muscle oxygen consumption. (a) Representative O2 consumption tracing (n=15 for leak, 7 for control, and 8 for PEMT-MKO) and (b) mean mVO2 under resting (vehicle; n= 9 for control and 14 for PEMT-MKO) or RyR-inhibited (vehicle+MgCl2; n= 6 for control and 7 for PEMT-MKO) conditions in EDL muscles from HFD-fed control and PEMT-MKO mice. (c) SERCA-dependent Ca2+ transport, ATP hydrolysis, and transport efficiency at pCa 5.8 (n=6 for control and 7 for PEMT-MKO). (d) Protein abundance of RyR, SERCA1, SERCA2, and GAPDH in soleus muscles from control and PEMT-MKO mice (n=4 per genotype). (e) Fluo-4 fluorescence intensity in basal and 2 mM 4-CMC-stimulated FDB fibers (n=7 for control and 8 for PEMT-MKO). (f, g) SR PC and PE in gastrocnemius muscles from control and PEMT-MKO mice (n=6 per genotype). (h) A targeting vector used to generate mice with conditional knock-in for PEMT. (i) PEMT mRNA levels in liver (n= 6 per genotype) and gastrocnemius muscles (n= 5 per genotype) from control and PEMT-MKI mice. (j, k) SR PC and PE in gastrocnemius muscles from control and PEMT-MKI mice (n= 6 per genotype). (l) Representative O2 consumption tracings (n=31 for leak, 12 for control, and 16 for PEMT-MKI) and (m) mean mVO2 (n=12 for control and 16 for PEMT-MKI) in EDL muscles from HFD-fed control and PEMT-MKI mice. (n) Protein abundance of RyR, SERCA1, SERCA2, and GAPDH (n= 8 per genotype). (o) SERCA-dependent Ca2+ transport, ATP hydrolysis, and transport efficiency at pCa 5.15 (n=6 per genotype). Data are shown as the mean ± s.e.m. All results are from 8 week HFD-fed mice. Statistical analyses in b,c,e,f,i,j,k,m,o were performed with an unpaired two-tailed t-test. Statistical analyses in a,l were performed with a two-way ANOVA.

