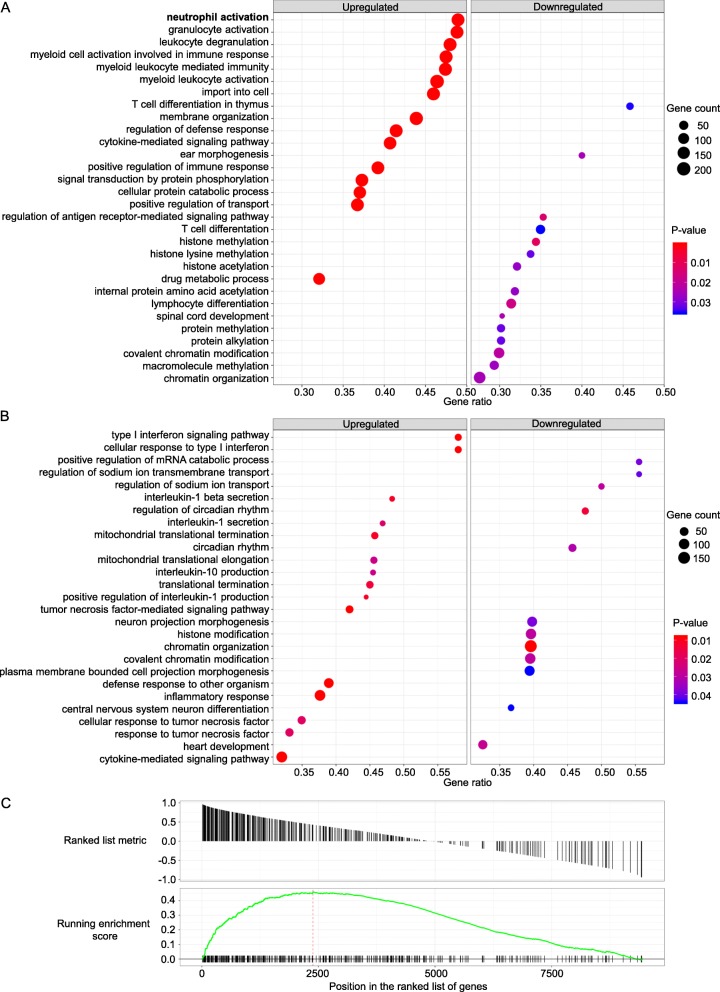
F ig. 2.
Results of the GSEA analysis. (a and b) Dot plots of GSEA results illustrating GO biological processes associated with HERV-K (HML-2) provirus 1q22 expression in both nonagenarian individuals and young controls respectively. The figures show the significant top 15 positively and the top 15 negatively enriched GO terms, based on co-expressed genes. There were only 12 significantly downregulated GO biological processes for the young. Gene count refers to the number of genes associated with each GO biological process. Gene ratio is the percentage of genes that significantly correlated with 1q22 expression from the total number of genes associated to that process. Terms are ranked in the figure by decreasing gene ratio. One GO term, “neutrophil activation”, directly involves neutrophil function and is bolded in the figure. (c) GSEA plot indicating enrichment of the biological process of neutrophil activation in the nonagenarians, based on the concentration of neutrophil activation –related genes at the beginning of the gene list ordered by correlation with 1q22 expression

