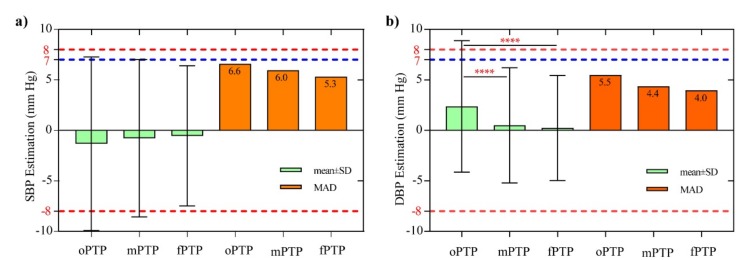
Figure 6.
Performance comparison during three different calibration methods in the dMK-BH model for (a) SBP and (b) DBP. Note 1: The red and blue dotted line denotes the largest boundary for the SD (8 mmHg) and mean absolute difference (MAD) (7 mmHg). Note 2: Significant differences: *p < 0.05, **p< 0.01, ***p< 0.001, and ****p< 0.0001.

