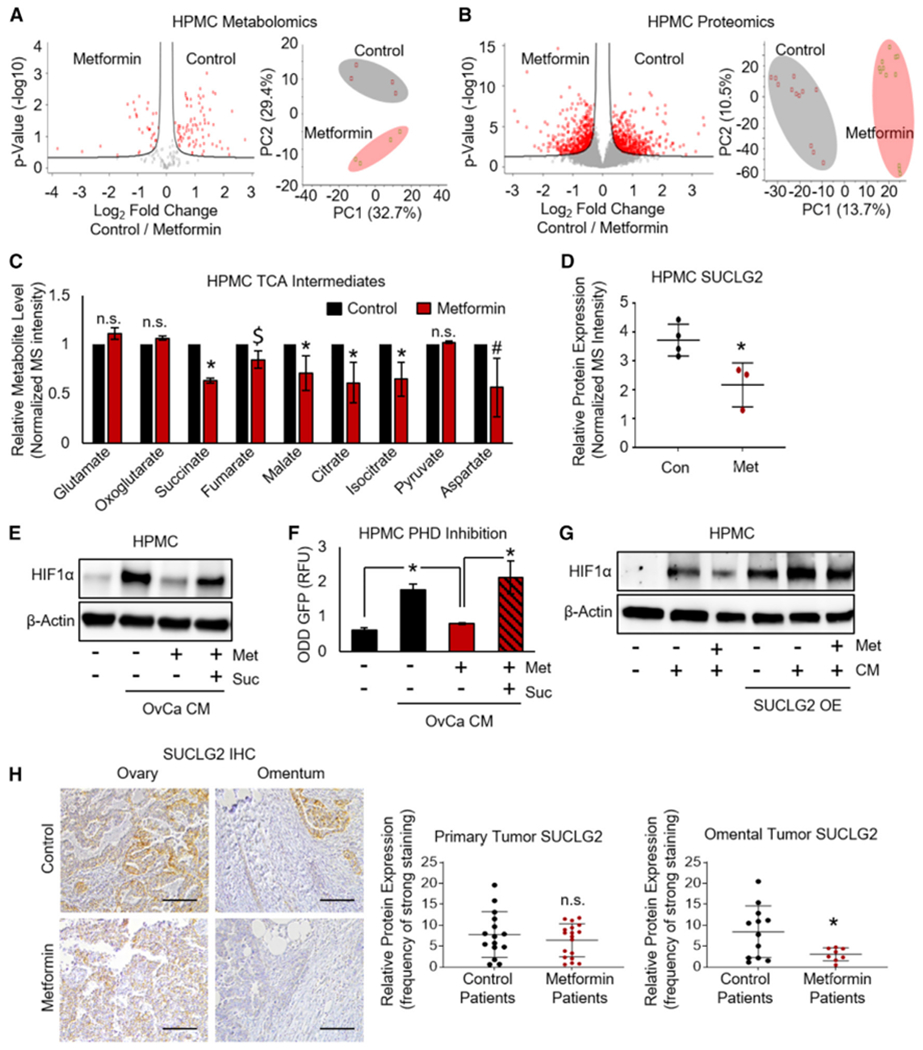
Figure 4. Metformin Represses SUCLG2 and TCA Intermediates to Inhibit HIF1α in Mesothelial Cells.

(A) Metabolomics. MS of metabolites extracted from mesothelial cells (HPMCs) treated with metformin (1 mM, 48 h)were analyzed using a two-sided t test with a FDR of 0.25 and an S0 value of 0.125. Left: volcano plot showing significant metabolites by red dots (n = 2 patients in duplicate). Right: principal-component analysis (PCA) assessing metabolite profiles of HPMCs treated with metformin compared to control. Open circles represent each group (n = 2 patients in duplicate).
(B) Proteomics. MS of proteins extracted from HPMCs treated with metformin were analyzed using a two-sided t test with an FDR of 0.05 and an S0 value of 0.1. Left: volcano plot showing significant proteins by red dots (n = 4 patients in triplicate). Right: PCA assessing protein profiles of HPMCs treated with metformin compared to control. Open circles represent each group (n = 4 patients in triplicate).
(C) Relative MS intensity of TCA metabolites in HPMCs treated with metformin from (A) was analyzed using a paired t test.
(D) Relative protein expression of the TCA enzyme SUCLG2 in HPMCs treated with metformin from (B) was analyzed using a paired t test.
(E) Western blot of HIF1α expression. HPMCs treated with metformin (250 μM, 72 h) followed by the addition of TYKnu OvCa CM ± succinate (suc, 5 mM) (representative blot from n = 2 patients in duplicate).
(F) Prolyl hydroxylase (PHD) activity using a GFP reporter construct. A GFP-tagged HIF1α oxygen-dependent degradation domain construct (ODD-GFP) was expressed in HPMCs; cells were then treated with TYKnu OvCa CM ± metformin (1 mM) ± succinate (suc, 5 mM) for 16 h. An increased GFP signal indicates depleted PHD activity (n = 2 patients in duplicate).
(G) Western blot of HIF1α expression. HPMCs were transfected with SUCLG2 and then treated with TYKnu OvCa CM ± metformin (1 mM, 48 h) (representative blot from n = 3 patients in duplicate).
(H) SUCLG2 immunohistochemical staining in primary ovarian and omental metastasis from OvCa patients with diabetes using metformin compared to non-diabetic patients with OvCa not taking metformin. Quantification of primary tumor (n = 15 and 17 for control and metformin, respectively) or omental metastasis (n = 12 and 8 for control and metformin, respectively) was performed using ImageScope software. Images are representative and were taken at 20× magnification; scale bar represents 100 μm.
Data represent mean values ± SDs. #p < 0.09, *p < 0.05; $p < 0.05 in one but not both patients tested; n.s., not significant.
