Figure 3.

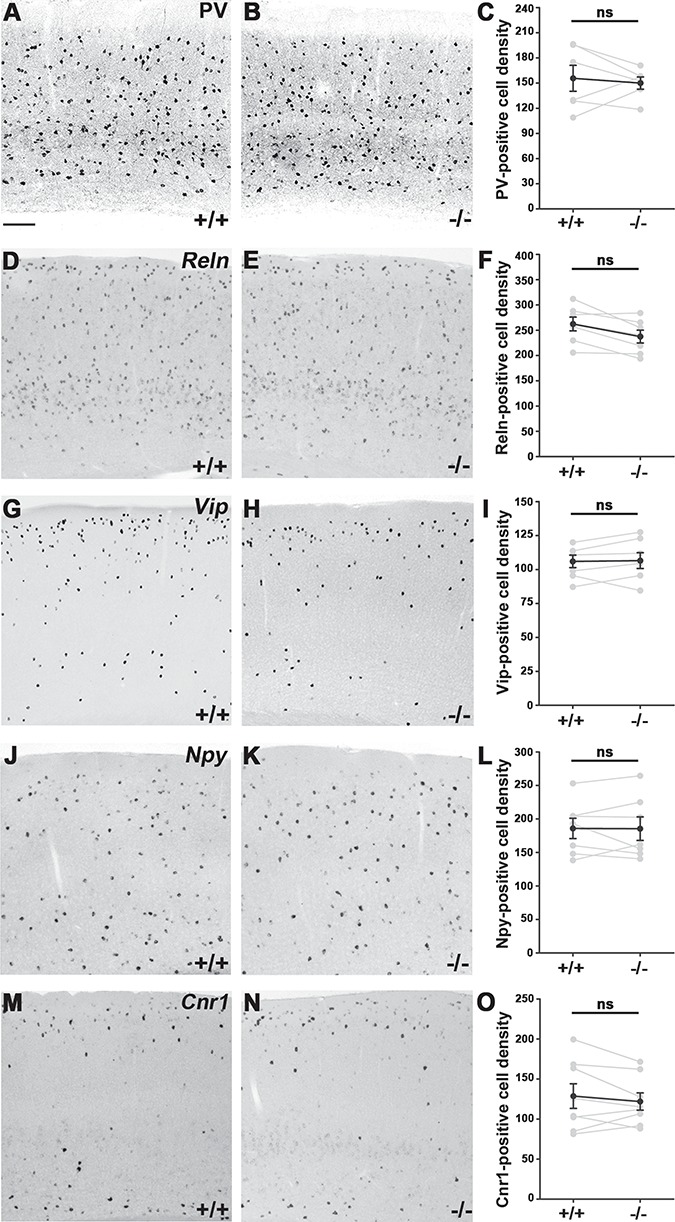
Quantitative comparison of various interneuron subtypes in the adult primer somatosensory cortex of +/+ and −/− animals. (A, B) Parvalbumin (PV) expression in the cortex of +/+ and −/− offsprings. (C) Statistical analysis: Mann–Whitney U test, P = 0.8182; +/+: n = 6; −/−: n = 6. (D, E) Reelin (Reln)-positive cells in the cortex. (F) Mann–Whitney U test, P = 0.2086; +/+: n = 7; −/−: n = 7. (G, H) Vasoactive Intestinal Peptide (Vip) expression. (I) Mann–Whitney U test, P = 1; +/+: n = 7; −/−: n = 7. (J, K) Neuropeptide Y (Npy)-positive cells in the somatosensory cortex. (L) Mann–Whitney U test, P = 1; +/+: n = 7; −/−: n = 7. (M–O) Cannabinoid receptor 1 (Cnr1)-positive cell numbers in littermates also show no significant differences between −/− and +/+ animals; Mann–Whitney U test, P = 0.9591; +/+: n = 8; −/−: n = 8. Statistical figures show mean values of sibling pairs (connected gray dots) and black connected dots represent means ± SEM. n indicates the number of mice per group. Scale bar shows 100 μm.
