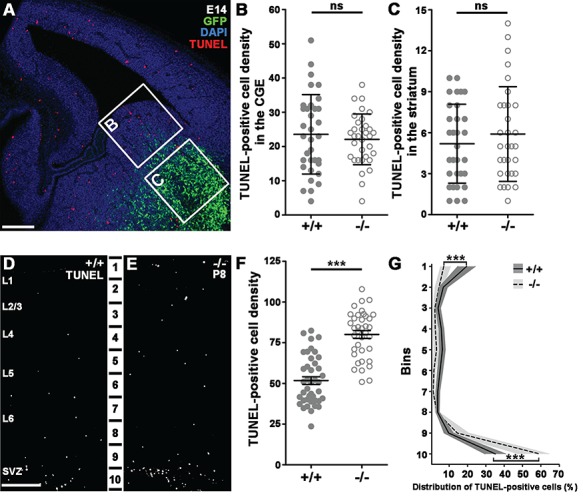
Figure 6.

Increased cell death in the somatosensory cortex of postnatal −/− animals. (A) TUNEL-stained E14 brain slice shows example quadrates for statistical analysis from CGE (B) and developing striatum (C). (B–C) Statistical analysis of TUNEL-positive cell density from distinct areas: CGE; Mann–Whitney U test, P = 0.7535; striatum: Mann–Whitney U test, P = 0.5429; +/+: n = 3; −/− n = 3. Graphs show raw data points and medians ± interquartile range (IQR). (D–E) P8 TUNEL-stained brain slices from +/+ (D) and −/− (E) animals. (F) Statistical analysis of TUNEL-positive cell density in the somatosensory cortex shows significant difference between littermates. +/+: n = 5; −/− n = 5; 2-tailed unpaired t-test; P < 0.0001, graph shows raw data points and means ± SEM. (G) Distribution analysis of TUNEL-positive cells in 10 equal bins. Bin1: Mann–Whitney U test, P < 0.0001; Bin2: Mann–Whitney U test, P = 0.4041; Bin3: Mann–Whitney U test, P = 0.2744; Bin4: Mann–Whitney U test, P = 0.0004; Bin5: Mann–Whitney U test, P = 0.0045; Bin6: Mann–Whitney U test, P < 0.0001; Bin7: Mann–Whitney U test, P = 0.0003; Bin8: Mann–Whitney U test, P = 1; Bin9: Mann–Whitney U test, P = 0.1; 2-tailed unpaired t-test, P < 0.0001; +/+: n = 5; −/− n = 5. Graph shows median ± interquartile range (IQR). n indicates the number of mice per group. Scale bars indicate 100 μm (A), 50 μm (D–E); L: layer.
