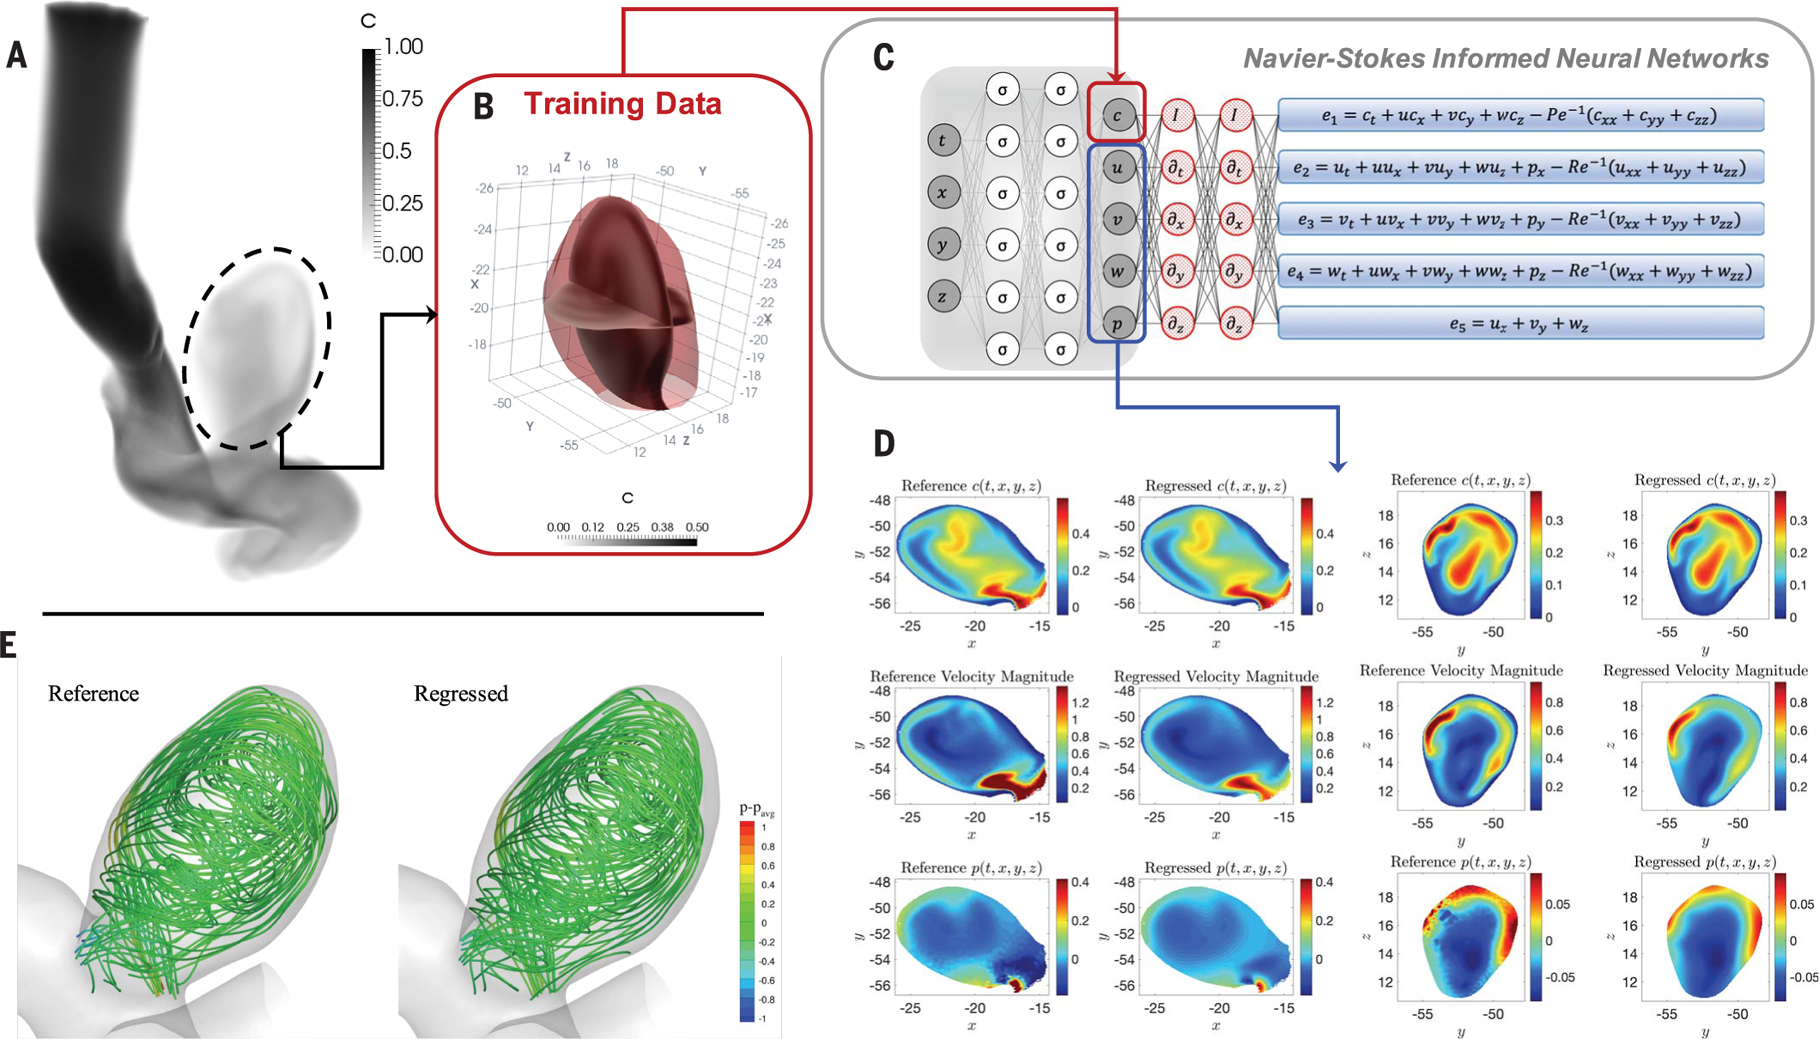
Fig. 3. Inferring quantitative hemodynamics in a 3D intracranial aneurysm.

(A) Domain (right internal carotid artery with an aneurysm) where the training data for concentration and reference data for the velocity and pressure are generated by using a direct numerical simulation. (B) The training domain containing only the ICA sac is shown, in which two perpendicular planes have been used to interpolate the reference data and the predicted outputs for plotting 2D contours. (C) Schematic of the NS-informed neural networks, which take c(t, x, y, z) data as the input and infer the velocity and pressure fields. (D) Contours of instantaneous reference and regressed fields plotted on two perpendicular planes for concentration c, velocity magnitude, and pressure p in each row. The first two columns show the results interpolated on a plane perpendicular to the z axis, and the next two columns are plotted for a plane perpendicular to the y axis. (E) Flow streamlines are computed from the reference and regressed velocity fields colored by the pressure field. The range of contour levels is the same for all fields for better comparison [movies S1 and S2, which correspond to (A) and (E)].
