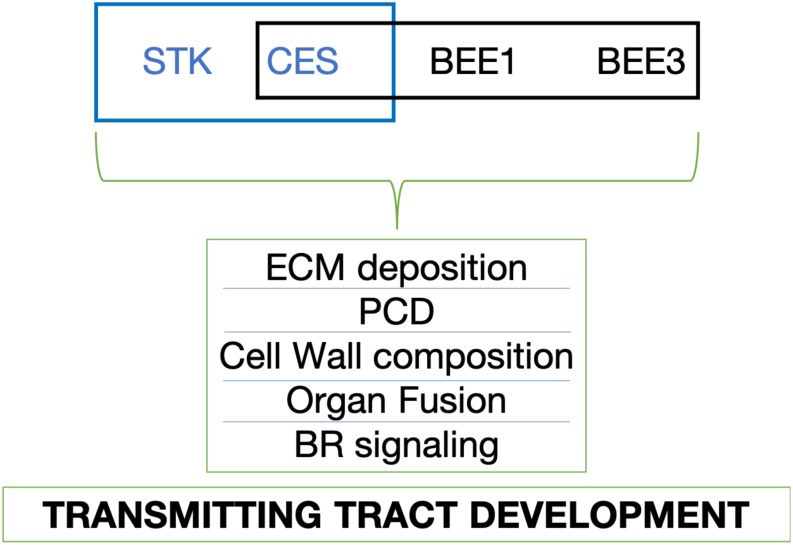
FIGURE 7.
Proposed model of transmitting tract development controlled by STK, CES, BEE1, and BEE3. The blue box symbolizes the interaction (STK-CES) that we found in this research project; The black box represents the interaction (CES-BEE1-BEE3) that has been previously described (Crawford and Yanofsky, 2011; Poppenberger et al., 2011). ECM, extracellular matrix; PCD, programmed cell death; BR, brassinosteroid.

