. 2020 Apr;32(2):175–185. doi: 10.21147/j.issn.1000-9604.2020.02.05

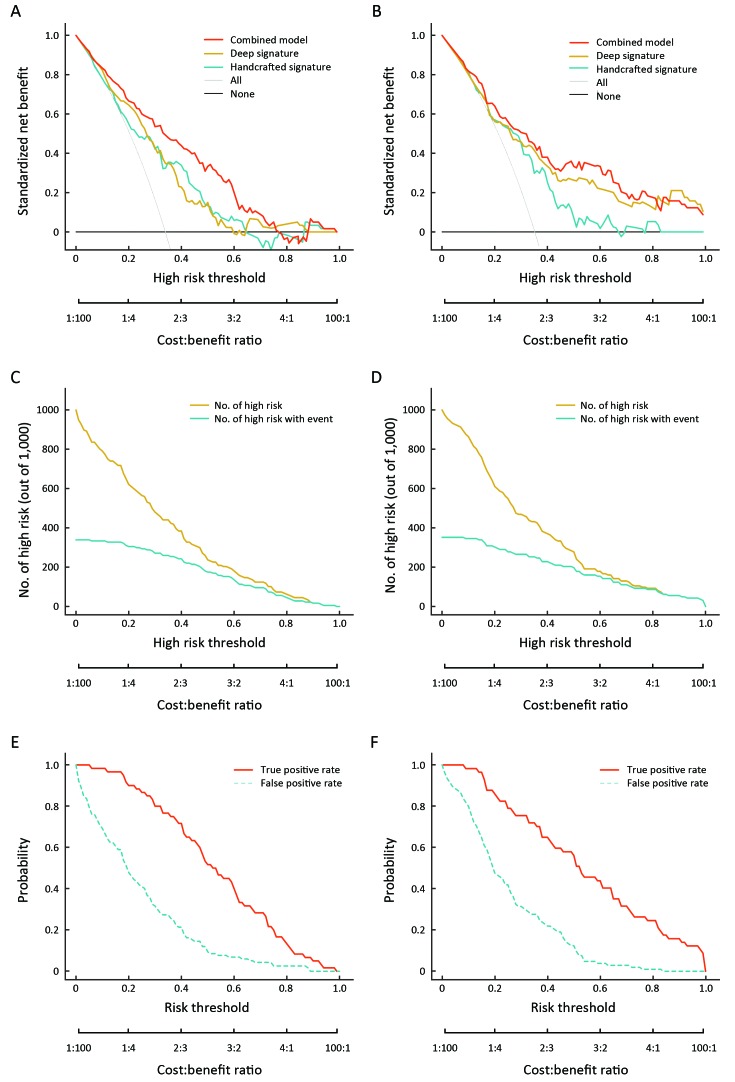
3. Evaluation of clinical usefulness. (A,B) Decision curves for the combined model and two radiomics signatures of primary cohort (A) and validation cohort (B). The vertical axis represents standardized net benefit. The two horizontal axes show the correspondence between the risk threshold and the cost-benefit ratio; (C,D) Clinical impact curve for combined model of primary cohort (C) and validation cohort (D). Of 1,000 patients, the solid yellow line represents the number of patients who would be considered high-risk human epidermal growth factor receptor 2 (HER2)-positive for each risk threshold by the combined model. The solid green line indicates the true positive cases with HER2-positive; (E,F) Receiver operating characteristic (ROC) component curve of the combined model for primary cohort (E) and validation cohort (F). The figure shows information similar to that of a ROC curve and also shows the true positive rate (solid red line) and false positive rate (dotted green line) in each risk threshold.

3