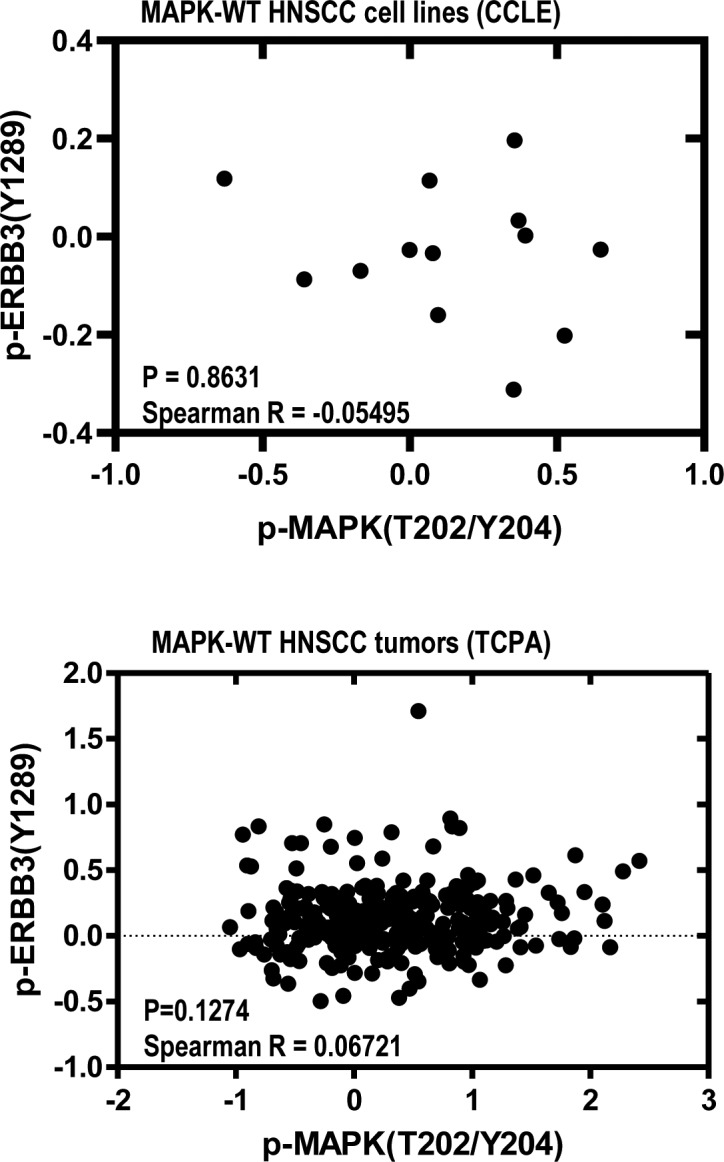
Figure S5. Protein–protein expression correlation graphs showing no significant correlations between expression levels of p-ErbB3(Y1289) and p-MAPK(T202/Y204) in MAPK-WT CCLE HNSCC cell lines and in MAPK-WT HNSCC patient tumors from TCPA proteome dataset.

Spearman rank correlation coefficients, and the respective P-values are shown.
