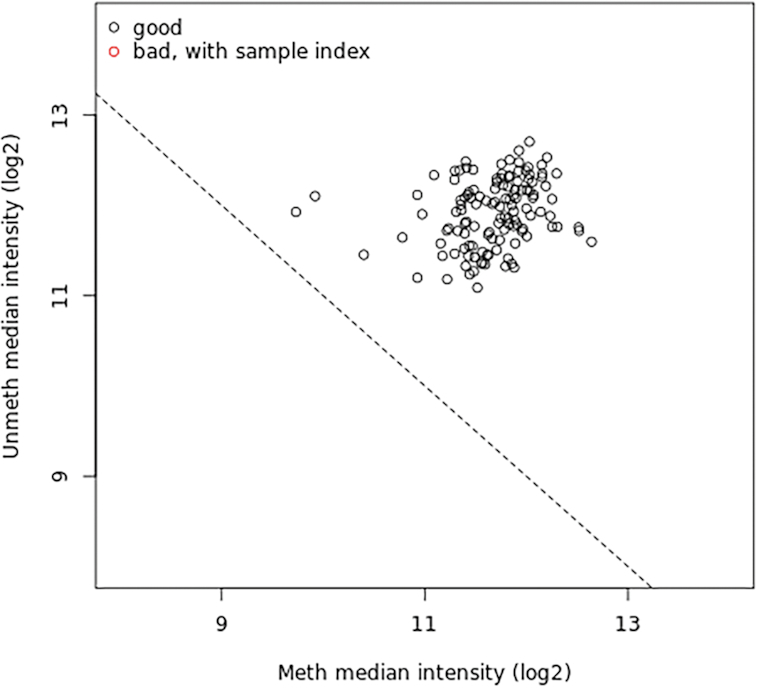
Figure 4:

Quality control plot representing median intensity of melanoma in samples before and after MAPKi treatment. The plot compares median total intensity (log2) of the methylated channel (x-axis) and unmethylated channel (y-axis). Bad-quality samples fall under the threshold and are colored red. There is no bad-quality sample in this study
