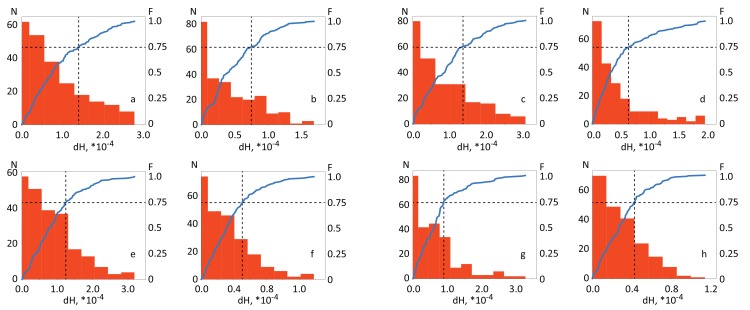
Figure 3.
Distribution of values (3) and cumulative distribution function F for different types of motor activity. (Upper line) Real movement: (a) HbO and (b) NbR for right hand and (c) HbO and (d) NbR for left hand. (Lower line) Motor imagery: (e) HbO and (f) HbR for right hand and (g) HbO and (h) HbR for left hand. The vertical dashed line indicates the border of the fourth quartile (75%) of the distributions. These results were obtained for subject .

