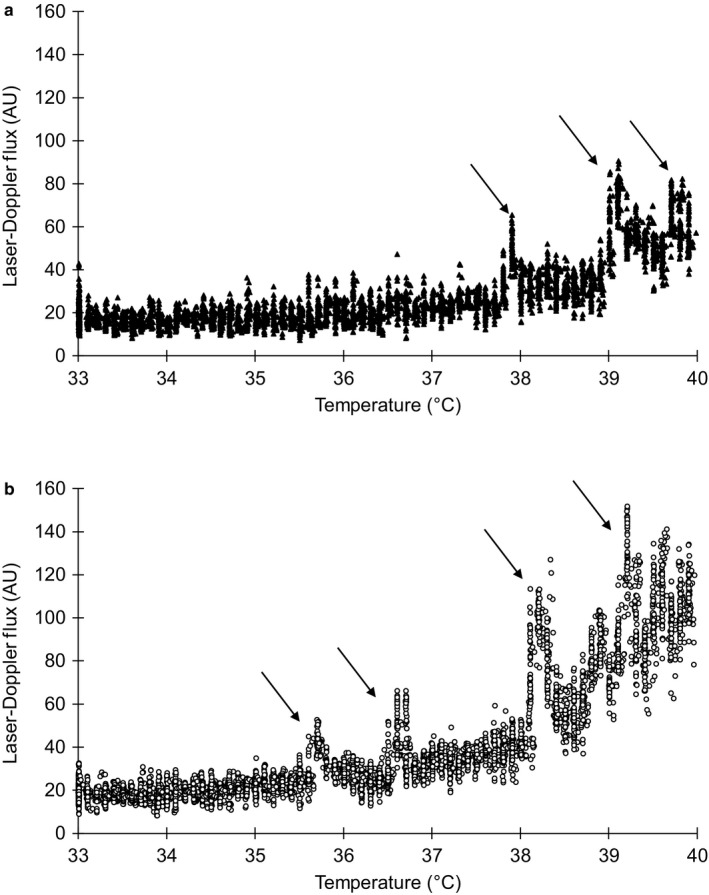
FIGURE 1.

(a and b) Representative tracing of the skin blood flow response to gradual local heating at the control site in one non‐Hispanic Black normotensive participant (a, top tracing) and one non‐Hispanic White normotensive participant (b, bottom tracing). Downward arrows indicate the first observed axon reflex response. Y‐axis values are laser‐Doppler flux units in order to magnify the axon reflex responses. For clarity, tracings for prehypertensive participants and for L‐NAME and SNP sites are not shown. L‐NAME, NG‐nitro‐l‐arginine methyl ester; SNP, sodium nitroprusside.
