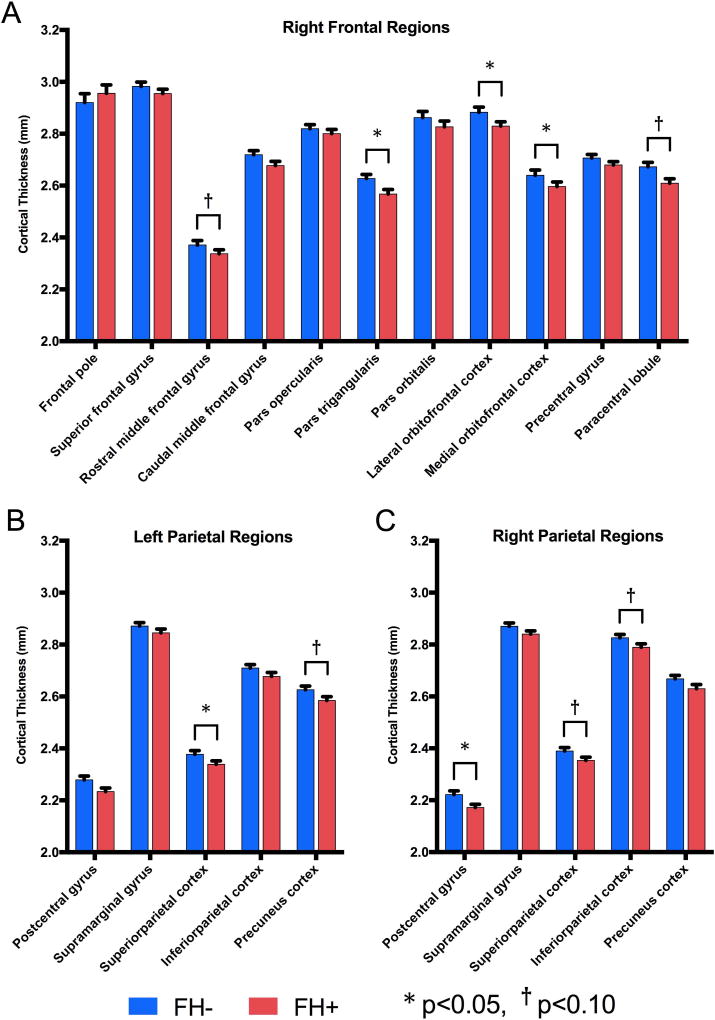
Figure 3.
Main effects of regional cortical thickness (mm) in (A) right frontal, and (B) left parietal, and (C) right parietal regions across groups were found using UNIANOVA with family history group and age bin as fixed factors and gender and total intracranial volume as covariates. Mean values with SEM bars shown. * p<0.05, † p<0.10.

