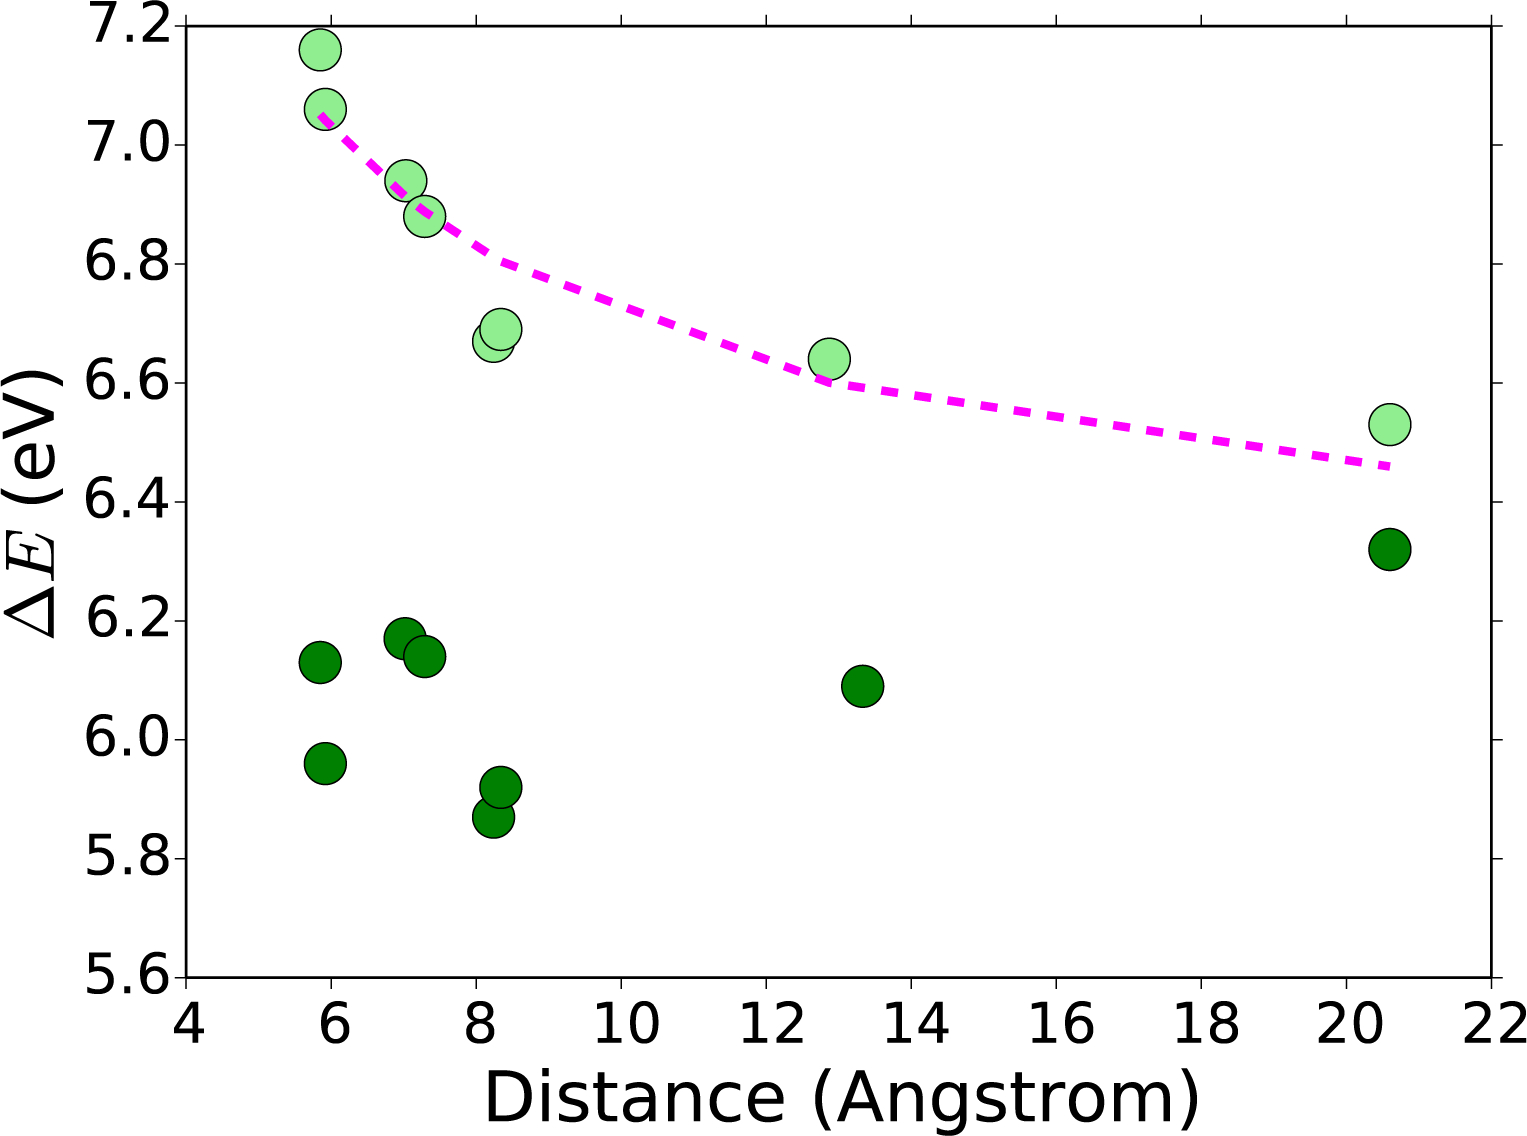
FIGURE. 8:

Absolute reduction potential (ΔE) (eV), of cluster B (light green), and cluster C (dark green), as shown in Figure 5. Various P450 geometries shown in relation to the Arg-Trp distance (Å). Fit of a function of the form to the Cluster B absolute reduction potentials (pink).
