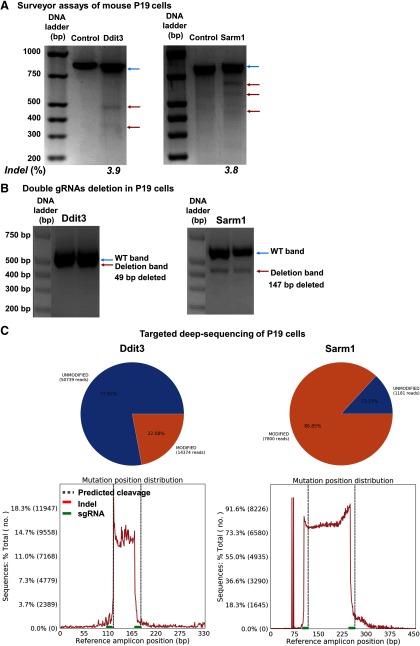
Figure 11.
The efficiencies of Ddit3 and Sarm1 genomic editing in mouse P19 cell line by CRISPR/Cas9. A, Surveyor assay revealing indel formation at the Ddit3 and Sarm1 genomic locus in mouse P19 cells after transfection with C/S gRNA and Cas9. Blue arrows are WT bands; red arrows are indel bands. B, Representative gel images showing WT and deletion bands of Ddit3 and Sarm1. Blue arrows are WT bands; red arrows are deletion bands. C, Schematic illustration of the insertion/deletion ratio and position distribution in the targeted regions of C/S gRNAs in mouse Ddit3 and Sarm1 locus, detected by deep sequencing.

