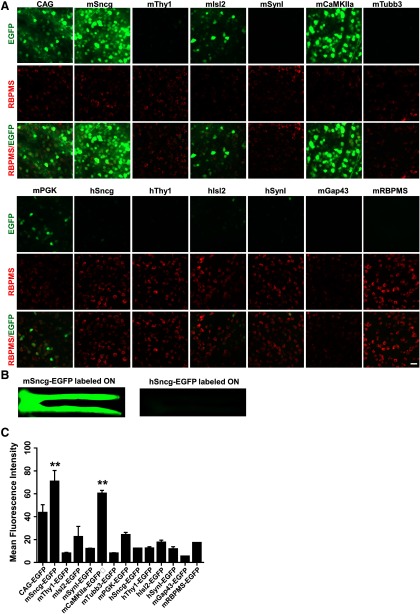
Figure 2.
Retinal and ON wholemounts showing EGFP intensities mediated by AAV2 with diverse promoters. A, Confocal images of retinal wholemounts showing EGFP expression at varying intensity levels driven by diverse promoters in RGCs. Scale bar, 20 µm. B, Low-magnification epi-fluorescence images of wholemount ONs containing optic chiasm showing EGFP expression in RGC axons. C, Mean EGFP fluorescence intensity in wholemount retinas. Data are presented as mean ± SEM, n = 3; **p < 0.01; one-way ANOVA with Tukey's post hoc test.

