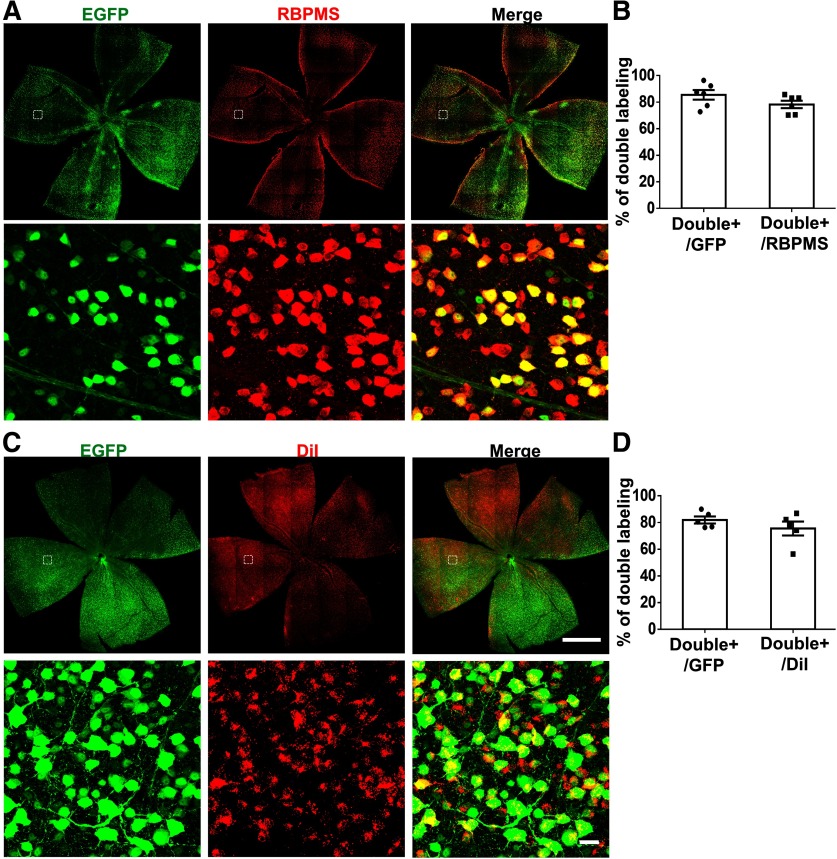
Figure 4.
Co-labeling AAV-mSncg-EGFP infected cells in mouse retina with RGC markers, RBPMS or retrograde tracing dye DiI. A, Confocal images of wholemount retina showing EGFP+ and RBPMS+ RGCs. B, Quantification of EGFP/RBPMS double-positive cells in retina. Data are presented as mean ± SEM, n = 6. C, Confocal images of wholemount retina showing EGFP+ and DiI+ RGCs. Scale bar for the whole-retina images, 1 mm. Scale bar for the enlarged white dotted square regions, 20 µm. D, Quantification of EGFP/DiI double-positive cells in retina. Data are presented as mean ± SEM, n = 5.

