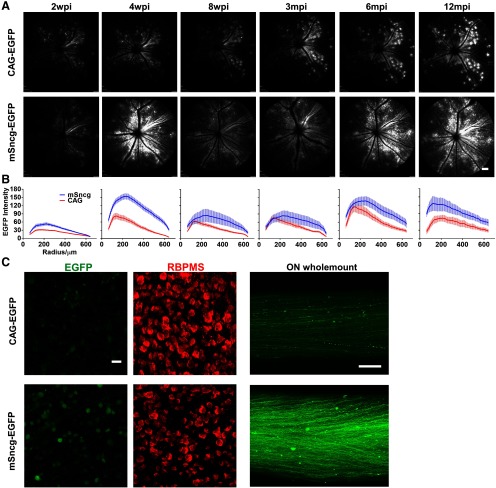
Figure 5.
Long-term EGFP expression driven by mSncg or CAG promoters in mouse RGCs. A, Live SLO retina fundus images showing EGFP expression in RGCs at different time points after AAV intravitreal injection. Scale bar, 100 µm. B, Quantification of EGFP fluorescence intensities at different time points after AAV intravitreal injection. Data are presented as mean ± SEM, n = 5–12. C, Confocal images of retina and ON wholemounts at 12 mpi (one year) showing EGFP+ RGC somata and axons. Scale bar of retina, 20 µm. Scale bar of ON, 100 µm.

