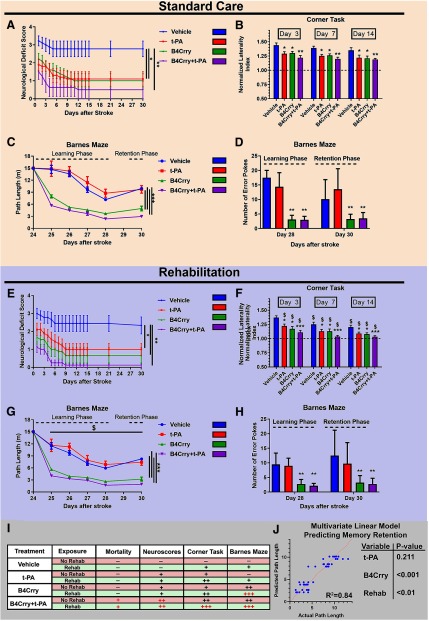
Figure 3.
Cognitive and motor recovery over a 30-d period after stroke, with acute t-PA, B4Crry, or combined treatment in the context of either spontaneous recovery or rehabilitation therapy. Animals subjected to MicroE were treated with t-PA, B4Crry, or combined B4Crry+t-PA at 2 h after emboli injection, and animal behavioral tests performed over 30 d. A–D, Animals were housed in standard cages with minimal enrichment (no rehabilitation; see Materials and Methods) for duration of experiment. Neurologic deficit scores (A) and measurement (B) of normalized laterality index on corner test after MicroE and 30 d of recovery. Two-way ANOVA with Bonferroni. N = 9–10/group; *p < 0.05 and **p < 0.01, comparisons to vehicle. Extended Data Figure 3-2 shows individual neurologic deficit data without using the last-observation carried forward paradigm, and the Hedges' g index for effect size. Performance on ladder rung task showed a similar pattern of recovery across groups and is shown in Extended Data Figure 3-3. C, D, Barnes maze test: animals treated with vehicle or B4Crry were trained on finding the escape hole on days 24–28 after MicroE. The path length to find the escape hole during training was computed using automated video analysis. The number of error pokes (nose pokes into non-target holes) was also computed. Retention of learned memory was assessed on day 30. Repeated measure two-way ANOVA with Bonferroni. N = 8/group; ***p < 0.001, comparison to vehicle and t-PA. E–H, Animals were assigned to rehabilitation cages on day 2 after MicroE (see methods), and the same analyses were performed as in A–D; *p < 0.05, **p < 0.01, ***p < 0.001 comparisons within the four groups subjected to rehab. $p < 0.05 compared with the corresponding groups in standard care category (A–D). Bars = mean ± SEM. Note: within each care group (standard or rehab), all pairwise combinations were tested on multiple comparison analyses to compare treatment groups (vehicle, t-PA, B4Crry, B4Crry+t-PA). Only findings that were significant are highlighted with *. Comparing care groups (standard vs rehab); $ denotes p < 0.05 when comparing corresponding treatment groups within each care category (e.g., vehicle vs vehicle+rehab, tPA vs tPA+rehab). Bars = mean ± SEM. I, Summary table of the impact of each intervention on the battery of motor and cognitive tasks performed. (–) denotes no effect and (+) denotes a significant improvement compared with vehicle. Red signs denote significant effect in Rehab compared to standard care. J, Multivariate linear regression model for prediction retention memory (path length) showing that B4Crry and rehab are independent predictors, with no effect for t-PA. B4Crry had significantly higher effect (Wald's = −5.8, p < 0.001) compared with rehabilitation (Wald's = −1.72, p < 0.01) in predicting path length. Pearson's correlation for the model, R2 = 0.84. See Extended Data Figure 3-1 for survival data. B4Crry did not have any impact on cognitive recovery in sham animals, as shown in Extended Data Figure 3-4.

