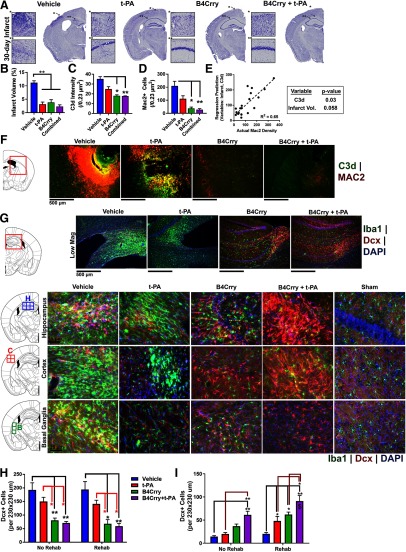
Figure 4.
Impact of infarct size and complement activation on microgliosis and migration of neuronal progenitor cells after stroke. Mice subjected to MicroE stroke were treated with vehicle, t-PA, or B4Crry+t-PA at 2 h after emboli injection, and brains isolated 30 d later. A, Nissl-stained sections of brains from each group showing regions of neuronal loss. B, Quantification of lesion volume across four groups. C, D, Quantification of mean intensity of C3d deposition and Mac2+ cells in the perilesional brain. One-way ANOVA with Bonferroni. N = 5/group; *p < 0.05, **p < 0.01. E, Multivariate linear regression model predicting the density of Mac2+ cells using C3d deposition and infarct volume as co-variates. Pearson's correlation R2 = 0.65, p < 0.0001. N = 20. F, Representative fields of perilesional brains quantified in C, D showing C3d (green) and MAC2 (red) staining. G, IF staining of Dcx+ (red) and Iba1+ (green) cells, with DAPI staining (blue), in the perilesional brain at 30 d after MicroE. Left panels show the stereotactic locations from which random fields were chosen. H, I, Quantification of G. One-way ANOVA with Bonferroni. N = 5/group; *p < 0.05, **p < 0.01. Bars = mean ± SEM. All pair wise comparisons within rehab and no rehab groups were performed, only results that are significant are highlighted with *. Comparisons were also made within each treatment group comparing rehab to no rehab, and significant findings are highlighted by the $ sign.

