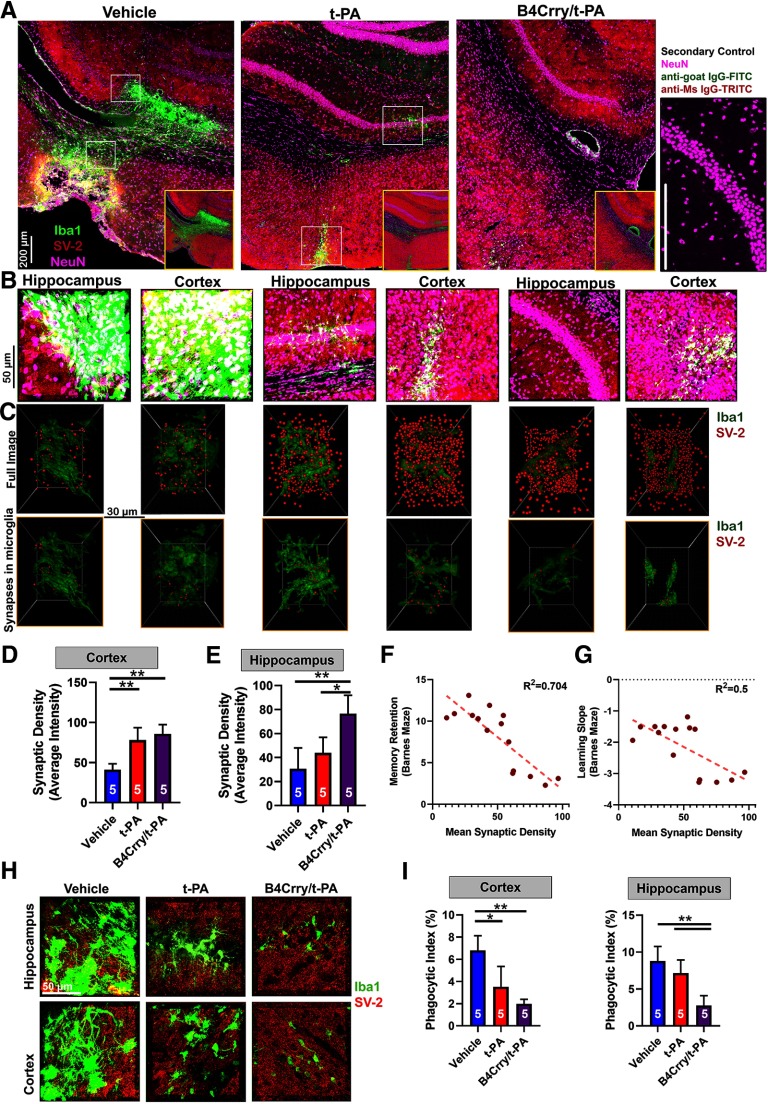
Figure 5.
Complement inhibition but not reperfusion therapy prevents degeneration of perilesional hippocampal synapses after stroke. Mice subjected to MicroE stroke were treated with vehicle, t-PA, or B4Crry+t-PA at 2 h after emboli injection, and brains isolated 30 d later. A, Large representative fields of the perilesional brain from the three treatment groups, depicting changes in microgliosis and synaptic density patterns between the groups in both the ipsilateral cortex and hippocampus (Iba1, green; SV-2, red; NeuN, pink). Right panel, Secondary antibody only control, representing slices stained with NeuN, anti-mouse IgG-TRITC (secondary control for SV-2) and anti-goat IgG-FITC (secondary control for Iba1). B, High-resolution IF fields from cortex and hippocampus in A. C, 3D reconstruction of microglia within the fields of B showing changes in synaptic density (SV-2, red; top panels) and the density of synaptic material in microglia (Iba1, green; lower panels) across the different locations and treatment groups. D, E, Quantification of high-resolution fields showing significantly higher density of synapses in the cortex of t-PA and B4Crry+t-PA-treated animals compared with vehicle treated (D), with no difference between the t-PA and B4Crry+t-PA groups. Synaptic density in the hippocampus (E), however, was significantly higher in B4Crry+t-PA-treated mice compare to both t-PA and vehicle. ANOVA with Bonferroni; *p < 0.05, **p < 0.01. F, G, Correlation of synaptic density with performance of animals on Barnes maze task. F, Correlation of synaptic density with path length. G, Correlation of synaptic density with the slope of change in path length during training, a surrogate measure for the speed of learning or acquisition of the task. Pearson correlation coefficients were obtained, R2 = 0.7 (F) and 0.5 (G) and p < 0.0001 for correlation. Extended Data Figure 5-1 shows the change of microglia and synaptic density spatially in relation to the edge of the gliotic scar across the different treatment groups. H, High-resolution stack of 40-μm slices showing the overlap between SV-2 and Iba1 staining. Representative sections from each group. Scale bar = 50 μm. I, Quantification of volume-based phagocytic index between the different groups showing significant reduction in phagocytic index in the hippocampus with combined treatment compared with t-PA or vehicle treatment. ANOVA with Bonferroni; *p < 0.05, **p < 0.01. For all panels, all pairwise comparisons were performed, only significant results are highlighted with *.

