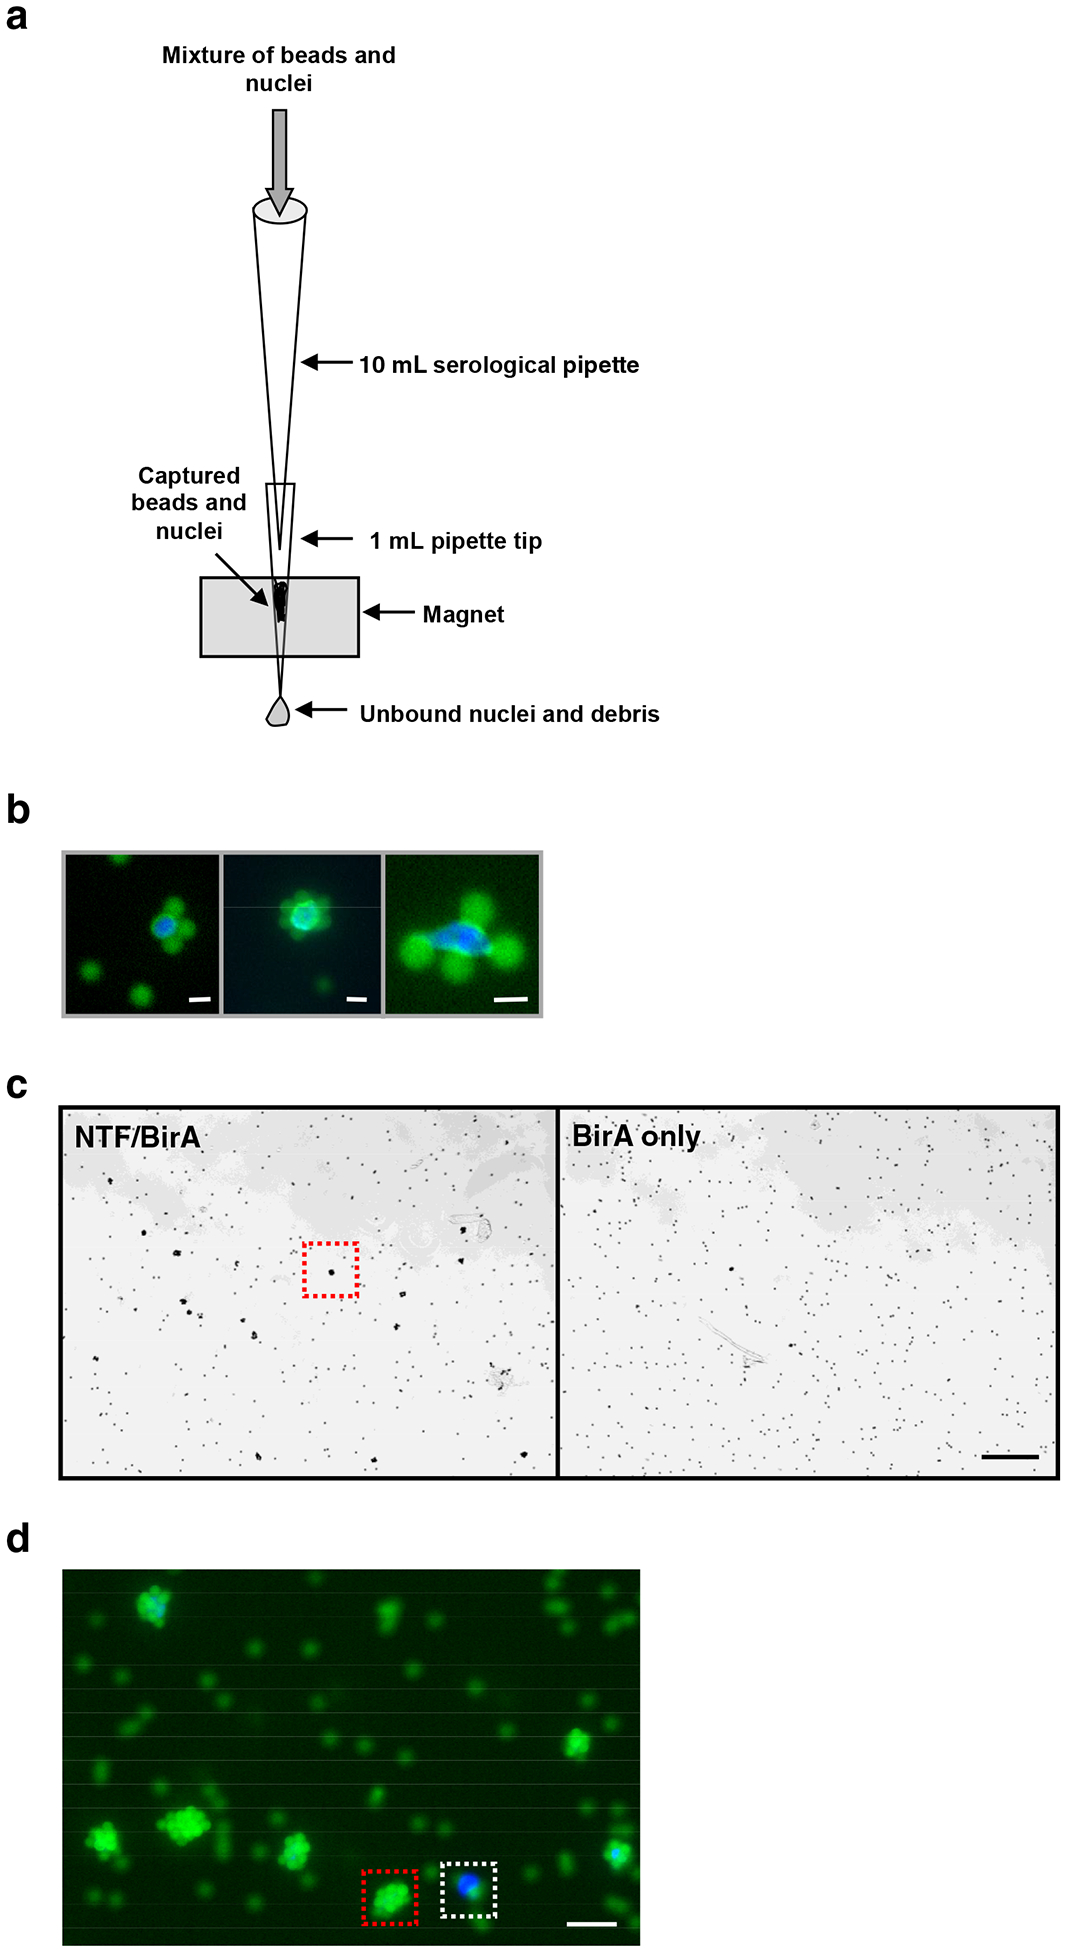
Figure 2. Purification of tagged nuclei with the INTACT system.

(a) Diagram of the apparatus used for purification of bead-bound nuclei. The core of the device consists of a 1 ml micropipette tip inserted into a groove in the surface of a miniMACS magnet. After binding of magnetic streptavidin-coated beads to biotinylated nuclei in solution, this mixture of beads and nuclei is diluted and drawn into a 10 ml serological pipette, and the pipette is then attached to the 1 ml tip in the magnet. The mixture of beads and nuclei in the 10 ml pipette is allowed to flow slowly past the magnet, allowing capture of beads and nuclei on the wall of the 1 ml tip. Once the liquid is drained, the 1 ml tip is attached to a pipette and the purified nuclei and beads are released into solution by drawing liquid into and out of the pipette tip. (b) Fluorescence microscopy images of NTF-labeled nuclei that have been bound by streptavidin-coated magnetic beads prior to capture on a magnet. DNA is shown in blue and GFP fluorescence of the NTF, as well as fluorescence from the beads themselves, are shown in green. Scale bar is approximately 3 μm in each panel. The right panel is at a higher magnification than the left and center panels. (c) Low magnification brightfield images of bead-bound nuclei and free beads after magnetic purification. The left panel shows the purified material from a transgenic line expressing NTF and BirA in root epidermal non-hair cells, while the right panel shows that from a line expressing only BirA. Labeled nuclei become fully coated with beads during capture on the magnet and therefore appear as conspicuous clusters of beads after purification. One such bead cluster is highlighted by a red dotted box in the NTF/BirA panel. No beads clusters are seen in the BirA only panel, indicating that the purification specifically recovers biotinylated nuclei from the cell type of interest. Scale bar is approximately 100 μm in each panel. (d) Higher magnification fluorescence image of purified material from the NTF/BirA line, as shown in the left panel of (c). The fluorescence of DNA is shown in blue and the fluorescence of beads is shown in green. Purity of the nuclei can be assessed by comparing the number of bead-bound nuclei that show green fluorescence from the beads (red box) to the number of free nuclei that show only DAPI fluorescence and are not bound by beads (white box). Scale bar is approximately 10 μm.
