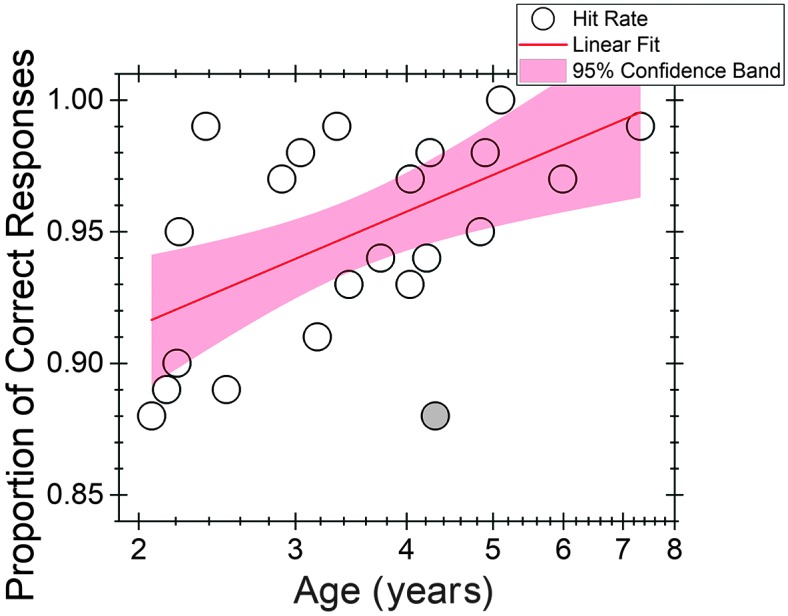
Figure 2.

Individual hit rates as a function of child age in log10 years scale. A linear function (line) was fitted to the data. The shading represents the 95% confidence bands for the regression line. Subject 6 (4.3 years old) was excluded from the model but is plotted here as a filled circle.
