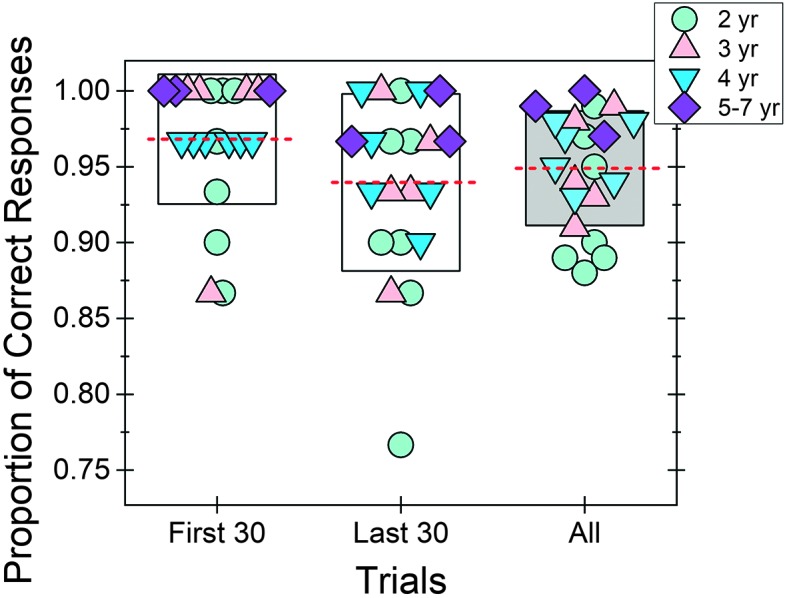
Figure 3.

Hit rate was calculated for three time points (Stage 3): first 30 trials, last 30 trials, and all (100) trials. For each time point, mean (dashed line) and individual hit rates (symbols) are provided. The box indicates ± 1 SD of the mean. Symbol type and fill reflect child age. yr = years.
