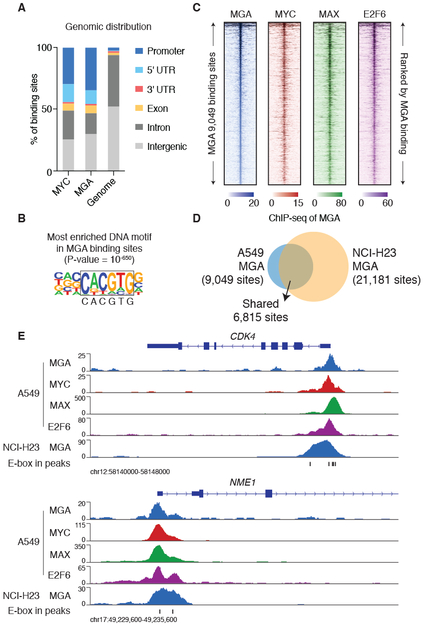
Figure 2: ChIP-seq analyses reveal that MGA co-localizes with MYC and E2F6 in the genome.
A. Genomic distribution of MYC and MGA binding sites in A549 cells.
B. Homer de novo motif analysis identified the top DNA motif enriched in MGA binding sites identified in A549 cells.
C. ChIP-seq signal of MGA, MYC, MAX and E2F6 (A549 cells) at the 9,049 MGA binding sites (top to bottom ranked by MGA ChIP-seq signal ±2.5kb centered at each MGA binding site).
D. Comparison of MGA ChIP-seq binding sites identified in A549 and NCI-H23 cells.
E. ChIP-seq signal of MGA in A549 and NCI-H23 cells, MYC, MAX and E2F6 in A549 cells at the CDK4 and NME1 loci. The E-box DNA motif (CACGTG) positions are indicated.

