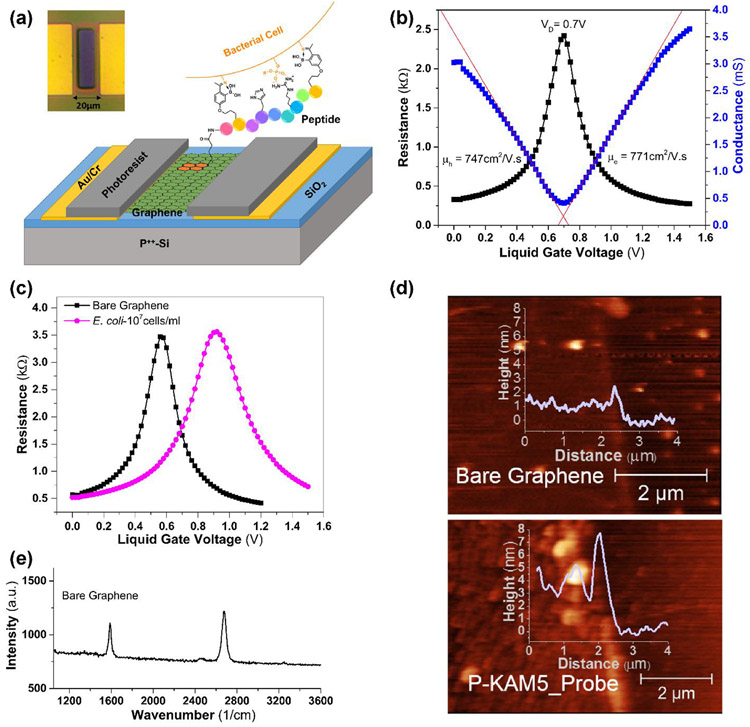
Figure 1. Scheme of functionalization and characterization of G-FETs.
(a) A schematic of a G-FET functionalized with a pyrene-conjugated peptide probe binding to the surface of a bacterium. The inset shows a light microscopy image of G-FET, with an active area of 10 x 40 μm, located in between two gold contacts. (b) Resistance/conductance vs voltage plots of G-FET representing the Dirac voltage (0.7 V), hole and electron mobilities of 747 and 771 cm2/V.s. (c) G-FET characteristics before and after adsorption of E. coli. A shift of 360 mV in the Dirac voltage observed when G-FET with bare graphene was incubated with E. coli (pink circles) in comparison with the bare graphene (black squares). (d) AFM image of the patterned graphene before and after peptide functionalization. After functionalization, the coverage of the graphene channel by the P-KAM5_Probe peptide is shown as an increase in height of ~2.5 nm (lower panel) compared with the bare graphene surface (upper panel). (e) Raman spectrum (532 nm excitation) of CVD graphene transferred over SiO2/Si substrate. The spectrum shows 2D peak at 2,679 cm−1 and G peak at 1,587 cm−1 with I2D/IG ~1.6, suggesting the graphene is monolayer. Absence of D peak ~1350 cm−1 indicating minimal defects in graphene.

