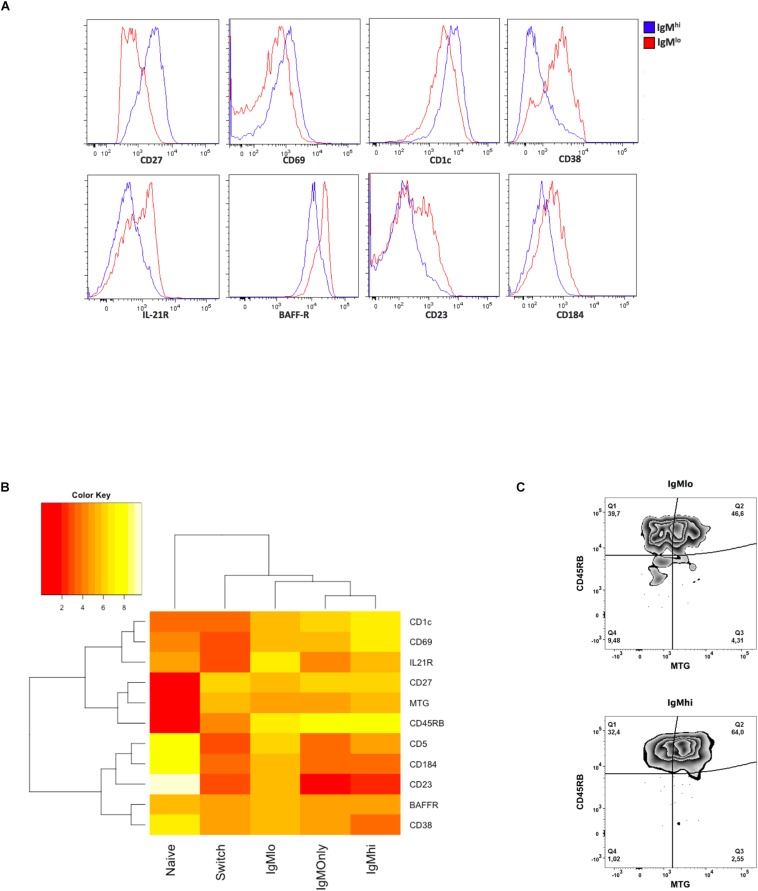
FIGURE 1.
Phenotypic profile of B cells subsets. Twenty-six markers were evaluated by flow cytometry on the different B cells subsets (complete results are presented in Supplementary Table 1). (A) Representative histograms of selected markers for which a statistically significant difference was observed with the Kruskal-Wallis and Wilcoxon signed-rank test, p < 0.05, between IgMhi (blue) and IgMlo (red) B cells. (B) Unsupervised clustering analysis of the median normalized iMFI from markers that were statistically different between IgMhi and IgMlo B cells. n = 5–18. To normalize the iMFI, raw values were square root transformed. Each transformed value was then multiplied by five and divided by the average of the transformed values in all five B cells subsets for each marker. (C) Representative plot of the joint expression of CD45RB (MEM55) vs. MTG in one volunteer, n = 7.

