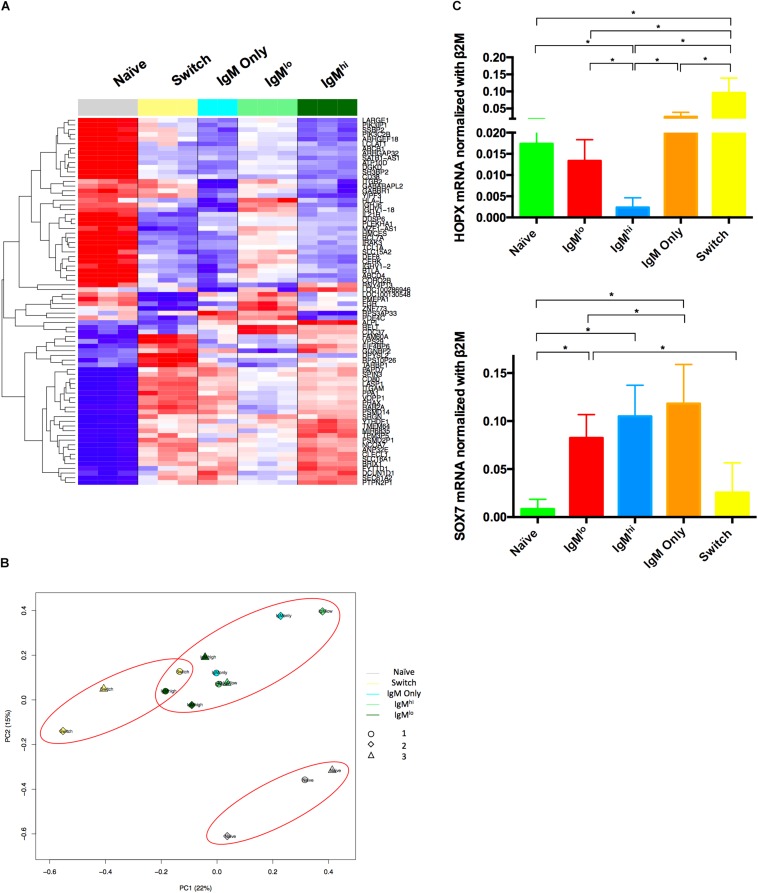
FIGURE 2.
Transcriptomic profile of B cells subsets. (A) Clustering analysis of the 78 genes that differed in expression between IgMhi and IgMlo B cells subsets with an FDRq LME-ANOVA < 0.001 and a p < 0.01. (B) PCA of Brainarray renormalized transcriptomic data adjusted by donor of the five B cells subsets performed as described in materials and methods. n = 3 for all subpopulations except for n = 2 for IgM only. Gene expression values are color coded, ranging from blue (low expression) to red (high expression), scaled by row, (C) RNA purified from sorted B cells were analyzed for the relative expression of HOPX and SOX7. n = 6. The relative expression of these genes normalized with the B2M gene is shown. Kruskal-Wallis and Wilcoxon test were used for evaluating differences among groups *p ≤ 0.05.

