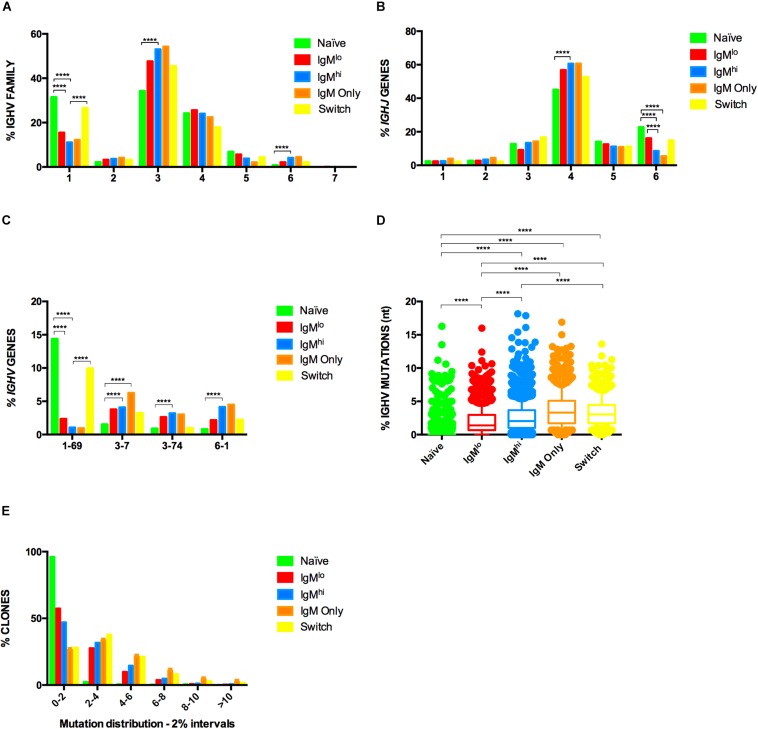
FIGURE 4.
Heavy chain repertoire of B cells subsets. Frequencies of IGHV family (A), IGHJ genes (B) and IGHV genes (C) used by different B cells subsets are shown. Samples from three donors were pooled and analyzed with Fisher’s test with p-value correction using FDR. In (C) shown are only the IGHV genes for which statistical differences were observed in all three donors studied. IGHV region mutations frequencies (D) were analyzed by Kruskal-Wallis test using Dunn’s multiple comparison test correction. The median and interquartile range of the three donors is shown. Only statistically significant differences observed in all three donors are shown ****p ≤ 0.00005, n = 3. (E) IGHV region mutations frequencies depicted as fraction of clones within six different 2% mutation intervals, from 0 to 2% (left) to >10% mutation frequency (far right).

