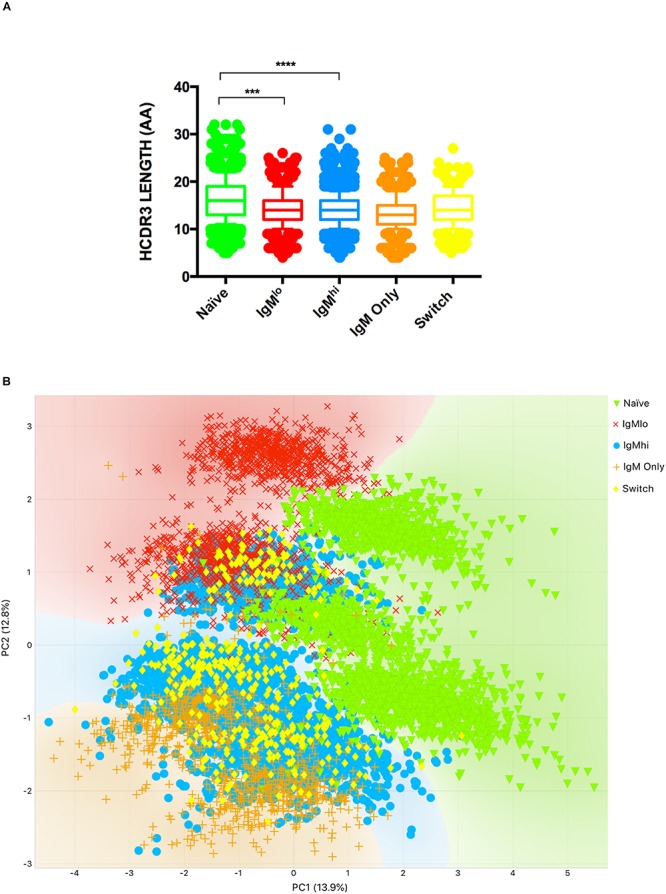
FIGURE 5.

Analysis of HCDR3. The length of HCDR3 aa (A) and bi-plot of PCA of HCDR3 properties (performed as described in Materials and methods) (B) of the different B cell subsets from 3 volunteers are shown. The median and interquartile range of the three donors is shown (A). Only statistically significant differences observed in all three donors are shown ***p ≤ 0.0005 and ****p ≤ 0.00005 (A), n = 3.
