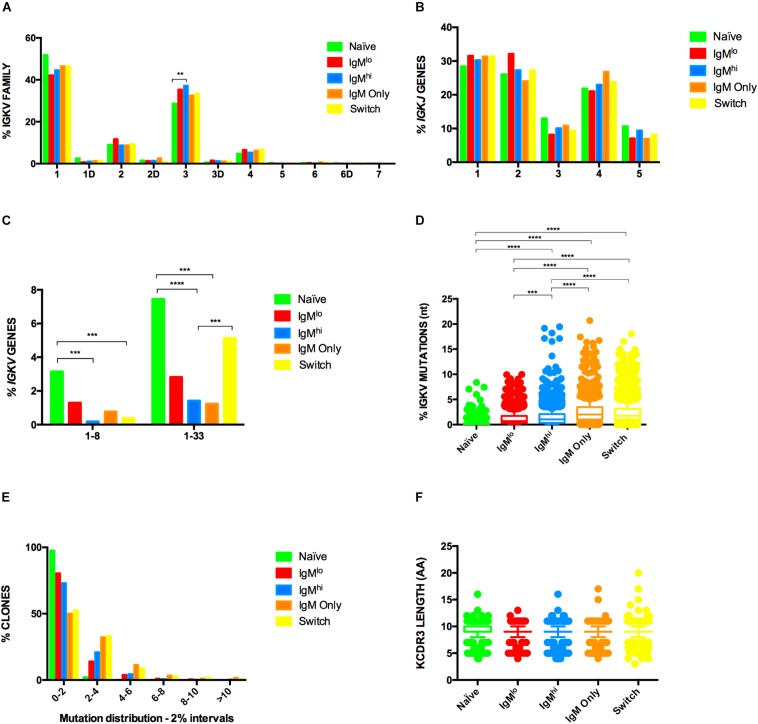
FIGURE 6.
Light chain repertoire profile of B cells subsets. Frequencies of IGKV family (A), IGKJ genes (B) and IGKV genes (C) used by different B cells subsets are shown. Samples from three donors were pooled and analyzed with Fisher’s test with p-value correction using FDR. and IGKV region mutations frequencies (D) were analyzed by Kruskal-Wallis test using Dunn’s multiple comparison test correction. The median and interquartile range of the three donors is shown. Only statistically significant differences observed in all three donors are shown. **p < 0.005, ***p < 0.0005, ****p < 0.00005, n = 3 IGKV region mutations frequencies depicted as fraction of clones within six different 2% mutation intervals, from 0 to 2% (left) to >10% mutation frequency (far right) (E). meadian of KCDR3 length is shown (F).

