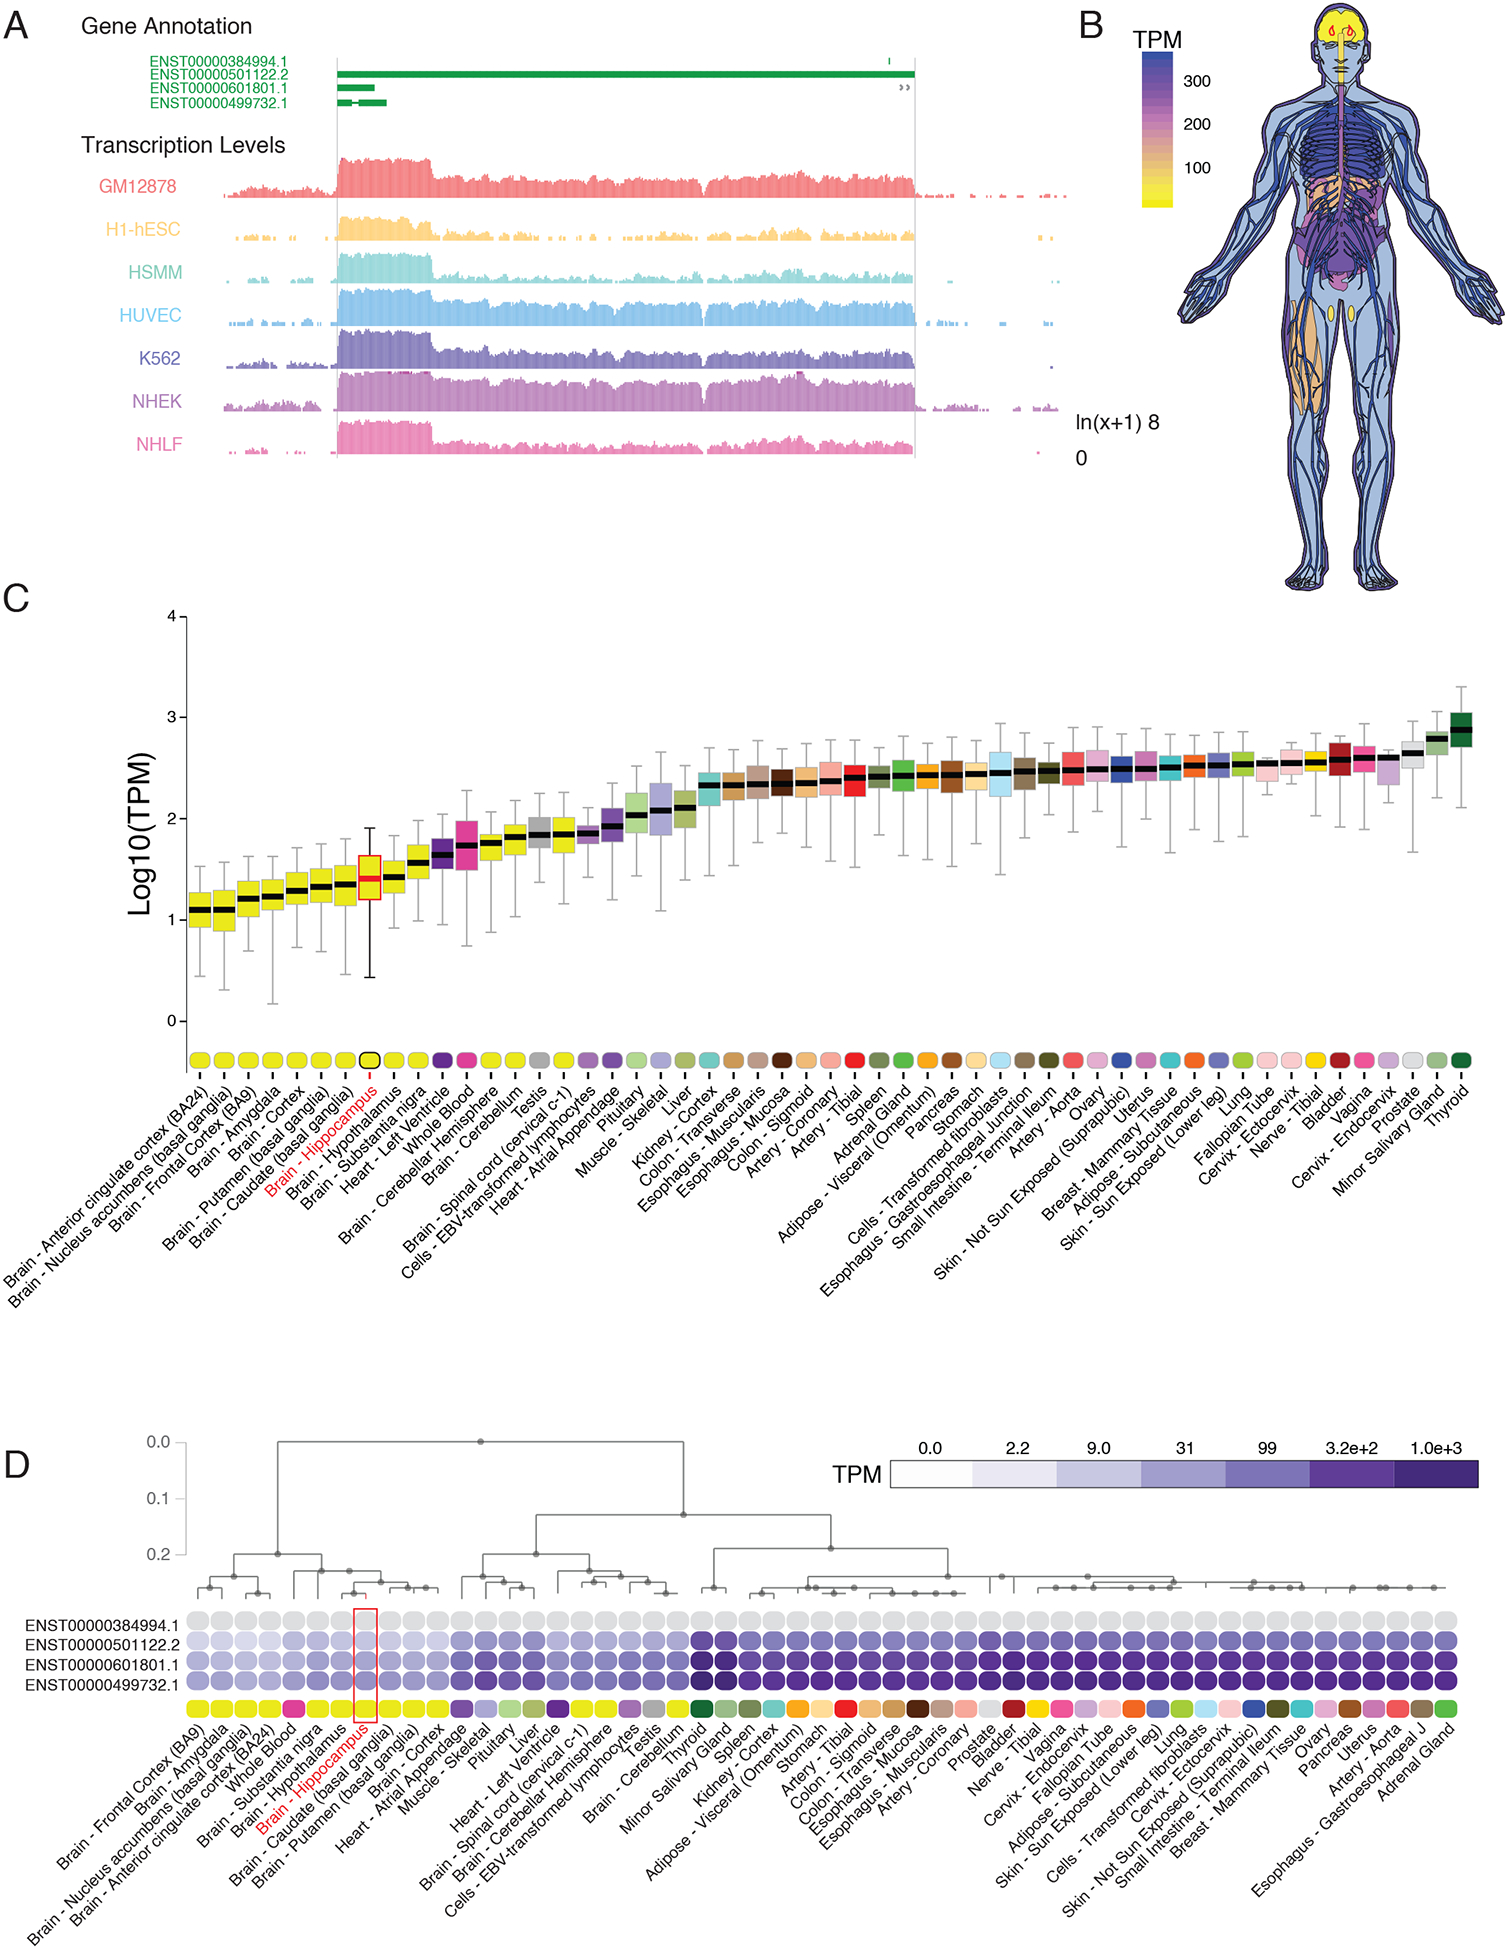
Figure 1. Restricted expression of lncRNA NEAT1 in human CNS tissues.

(A) University of California, Santa Cruz (UCSC) Genome browser track export showing expression of NEAT1 in seven cell types from ENCODE. (B) Human body plot illustrating the expression of NEAT1 in 53 human tissues from the GTEx project, values shown are the median transcripts per million (TPM) values by tissue, hippocampus outlined in red. (C) Bar plots showing median, upper quartile, and lower quartile expression of the NEAT1 gene (ENSG00000245532.4) in 53 human tissues from the GTEx project; hippocampal expression outlined in red. (D) Hierarchical clustering of NEAT1 based on transcript isoform level expression in 53 human tissues from the GTEx project. Dendrogram scale shows cluster distance. Expression values displayed in the heatmap are the median expression values in TPM for each isoform in each tissue. See data file S1 for complete n values for all tissue types.
