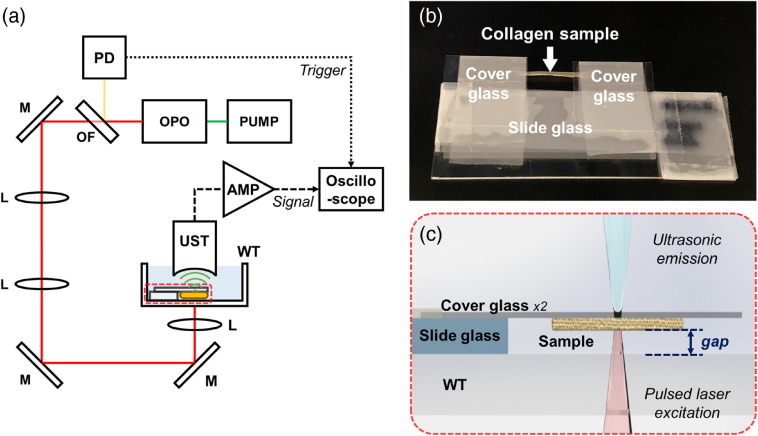
Fig. 1.
(a) Schematic diagram for the measurement system for the effective PA absorption spectrum. (b) Photograph of the sample preparation. (c) Side view of an enlarged diagram of the sample positioning. OPO, optical parametric oscillator; OF, optical filter; PD, photodetector; M, mirror; L: lens; WT, water tank; UST, ultrasonic transducer; and AMP, amplifier.

