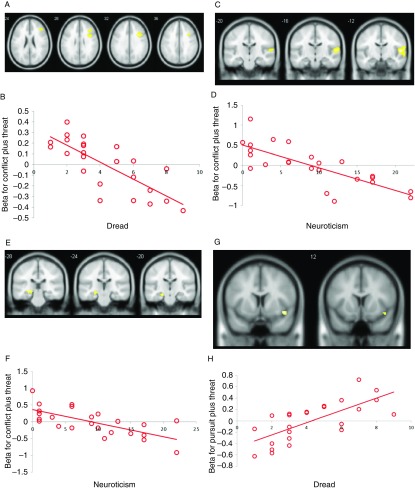
Figure 4.
Scatterplots showing effect on BOLD signal of inter-individual differences in dread elicited by threat of electric shock and also neuroticism (as measured by the Eysenck Personality Questionnaire). (A, B) Right dorsolateral prefrontal cortex [32, 12, 34]. (C, D) Right superior temporal gyrus [52, −12, 8]. (E, F) Left hippocampus [−22, −22, −15]. (G, H) Operculum/right posterior insula [48, 8, −12]. Each point represents an individual’s response on the self-report measures.

