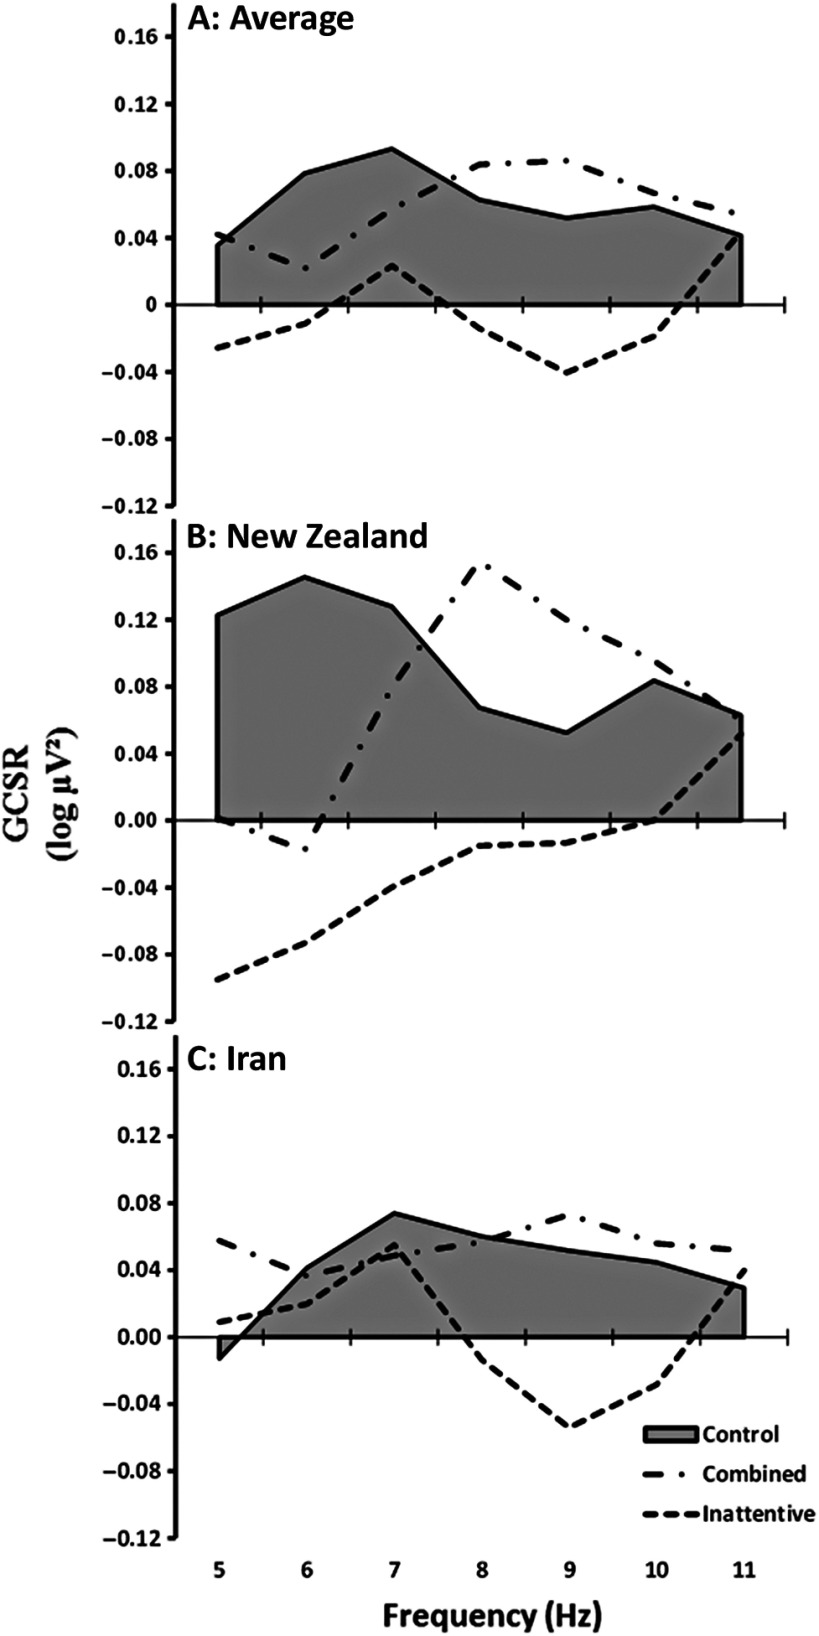
Figure 3.
Variation in goal-conflict-specific rhythmicity (GCSR) at F8 for each frequency averaged across all participants for the three diagnostic groups (control, combined and inattentive subtype) for Block 2 of the SST. The data were smoothed with a 3-point running average for display but not analysis. (A) an average of the results from the two centres. (B) results of initial study (New Zealand). (C) results of main study (Iran).

