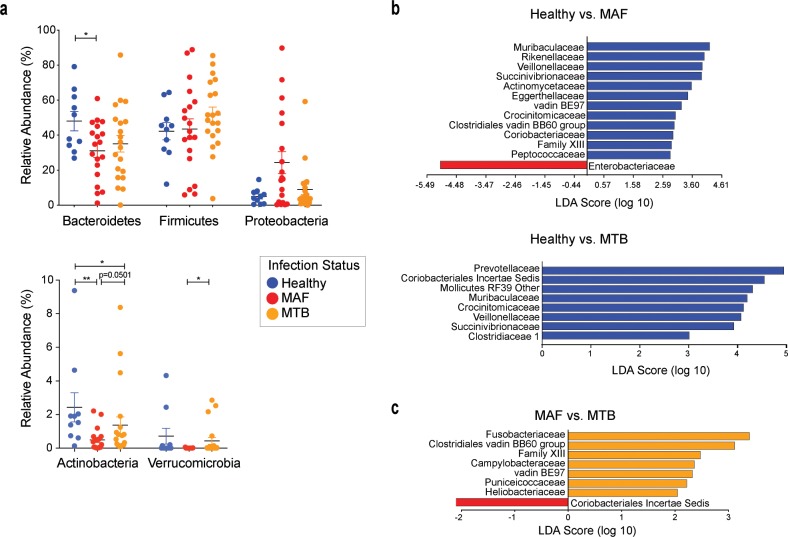
Fig 2. Alterations in the composition of the intestinal microbiome of MAF- and MTB-infected patients at the time of diagnosis.
a. Relative abundances of the five most prominent phyla are compared between the three groups. Significant differences calculated using the non-parametric Mann-Whitney U test are indicated. *p < 0.05, **p < 0.01 (Significant differences identified using the parametric Student’s t-test are as follows: Bacteroidetes Healthy vs MAF p < 0.05, Proteobacteria Healthy vs MAF p < 0.05, MAF vs MTB p < 0.05, Actinobacteria Healthy vs MAF p < 0.01, Verrucomicrobia Healthy vs MAF p < 0.05). b-c. LEfSe analyses were performed to identify differentially abundant families in the two infection groups, MAF and MTB, compared to the healthy participants (b) and between the two infection groups (c). Taxa are filtered for p < 0.05 and linear discriminant analysis (LDA) score > 2.

