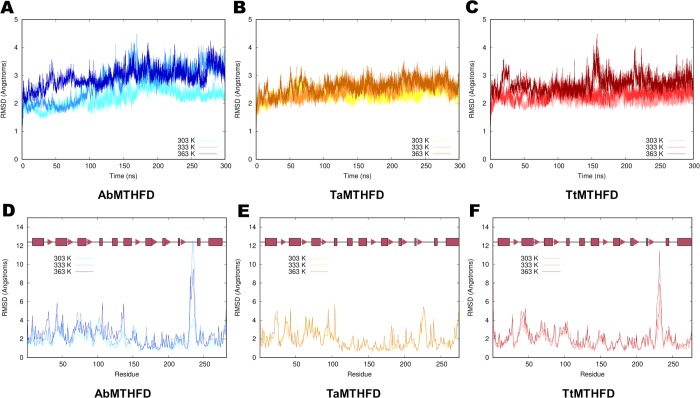
Fig 2. RMSD trajectory analysis.
Comparison of RMSD plots (in Å) of Cα atoms of 300 ns MD simulations of (A) A. baumannii at different temperatures (303 K light blue, 333 K blue, 363 K dark blue), (B) T. acidophilum (303 K yellow, 333K light orange, 363 K dark orange) and (C) T. thermophilus MTHFD (303 K light red, 333K red, 363 K dark red). Comparison of per-residue average Cα RMSD values (in Å) of (D) A. baumannii (E) T. acidophilum and (F) T. thermophilus MTHFD with colors as shown above and secondary structure elements indicated in red (boxes for α-helices, triangles for β-sheet strands).

