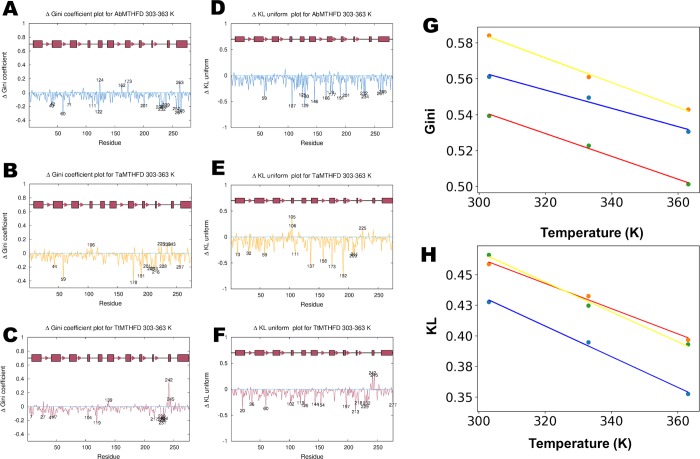
Fig 5. Rotamer analysis.
Per-residue rotamer distributions plotted as Gini coefficient differences (ΔGini, GCD) calculated for the 303 K and 363 K trajectories of the (A) A. baumannii (blue), (B) T. acidophilum (yellow) and (C) T. thermophilus (red) molecular dynamics simulations. Additionally, the ΔKL (difference Kullback-Leibler divergence) coefficients were calculated in a similar manner for the (D) A. baumannii, (E) T. acidophilum and (F) T. thermophilus simulations. Important residues with a GCD and ΔKL cut off above 2 standard deviations, are highlighted showing a more uniform distribution in the more thermophilic T. thermophilus structure than the other two proteins. (A) AbMTHFD shows several amino acids with significantly reduced Gini coefficients. Whereas some residues are solvent exposed (His 232, Asp 235, Val 239, on lid loop; Asp 42, Glu 111, Gln 201, Asp 228 on other regions), several of these amino acids are in the hydrophobic core (Val 40, Val 60, Val 122, Val 257, Val 261, Thr 265), confirming an indication of a beginning denaturation of the protein. (B) TaMTHFD showed less residues with strongly reduced Gini coefficients (like Tyr 44, Val 59, Ser 178, Thr 191, Val 201, Gln 208, Thr 213, Ser 216, Asp 228, Thr 257) during the 303 K to 363 K transition. (C) TtMTHFD showed several surface-exposed mostly hydrophilic and charged amino acids with significantly decreased values (e.g. Asn 229, Val 231, Glu 232 and Arg 234 from the lid loop, as well as Ser 7, Ser 27 and Gln 104 from other regions). Additionally, some hydrophobic side-chain residues like Pro 41 and Phe 119 as well as hydrophobic core related residues like Val 47 and Val 217 showed significantly decreased Gini coefficients. (D) Similar to the Gini analysis, AbMTHFD showed significantly lowered KL divergence for both solvent exposed and buried amino acids, like His 232, Arg 234 (lid loop), Arg 166, Arg 191, Gln 201 (solvent exposed, nucleotide binding domain), Met 146, Met 174, Met 177 (buried, nucleotide binding domain) Leu 125, Arg 129, (connector helix, solvent exposed), Met 130 (CH, buried), Val 261, Thr 265 (C-terminal helix); Arg 59 and Arg 107 (nucleotide binding domain). (E) TaMTHFD showed significantly lowered KL divergence for the solvent exposed amino acids Lys111, Arg 137, Arg 158, Arg 173, Arg 192, Arg 209 and the semi exposed residue Met 211 (from the nucleotide binding domain), Lys 13 (solvent exposed, N-terminal helix), Leu 32 and Val 59 (buried, substrate binding domain). (F) In TtMTHFD several residues showed significantly lowered KL divergence like Asn 229, Glu 232 (from the lid loop); Arg 144, Arg 197, Arg 213, Arg 218 (solvent exposed charged amino acids from the nucleotide binding domain); Phe 119, Arg 126 (from the CH helix) and Arg 20, Arg 36, Arg 60, Arg 102 (all solvent exposed from the substrate binding domain). (G) Shows the average Gini coefficient values for the three proteins colored in the scheme described above for the three temperatures, indicating that this parameter drops with higher temperatures as expected. (H) To corroborate this, the KL divergence values were plotted for the three temperatures and three proteins.

