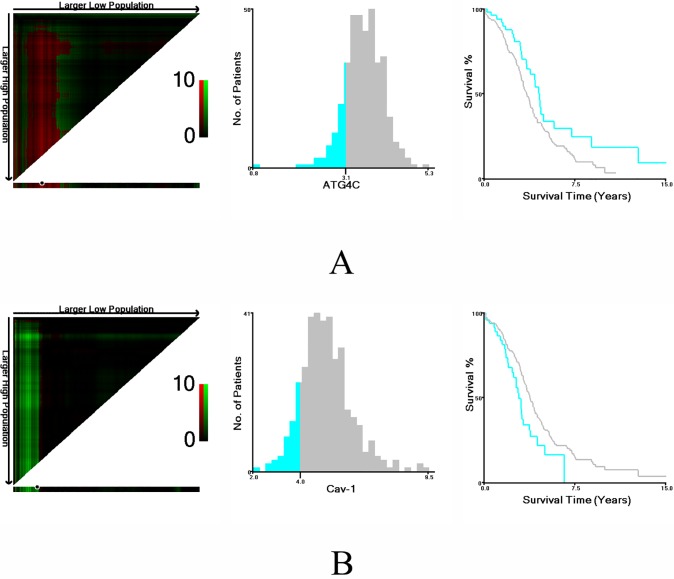
Fig 1. Determination of cut-off values of ATG4C and CAV1 mRNA expression in TCGA database and survival analyses.
X-tile analysis of survival data in TCGA database was performed to determine the optimal cut-off value for ATG4C and CAV1 expression. The sample of ovarian cancer patients was equally divided into training and validation sets. X-tile plots of training sets are shown in the left panels, with plots of matched validation sets shown in the smaller inset. The optimal cut-off values highlighted by the black circles in left panels are shown in histograms of the entire cohort (middle panels), and Kaplan-Meier plots are displayed in right panels. P values were determined by using the cut-off values defined in training sets and applying them to validation sets. A) The optimal cut-off value for ATG4C was 3.14 (χ2 = 5.427, P = 0.0201). B) The optimal cut-off value for CAV1 was 3.98 (χ2 = 4.863, P = 0.0269). Subsequently, the differences in the Kaplan-Meier survival curves between patients with high and low expressions of CAV1 and ATG4C mRNA were assessed by the log-rank test. Results showed that the low-expression group of CAV1 mRNA (P = 0.021, Fig 2A) and the high-expression group of ATG4C mRNA(P = 0.018, Fig 2B) had significantly shorter OS.

