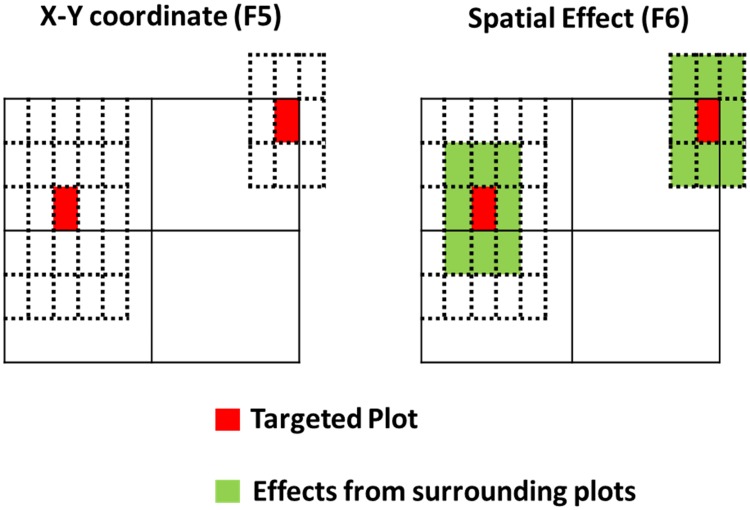
Fig 2. Illustration of spatial effects employed in the F5 and F6 test.
In the F5 test, we fitted X- and Y-coordinates as the spatial effect in the model, whereas for the F6 test, we included its eight surrounding plots as well in the spatial effect (as a moving average). The figure was adapted from and originally drawn by Andrea Bellucci (pers. comm.).

