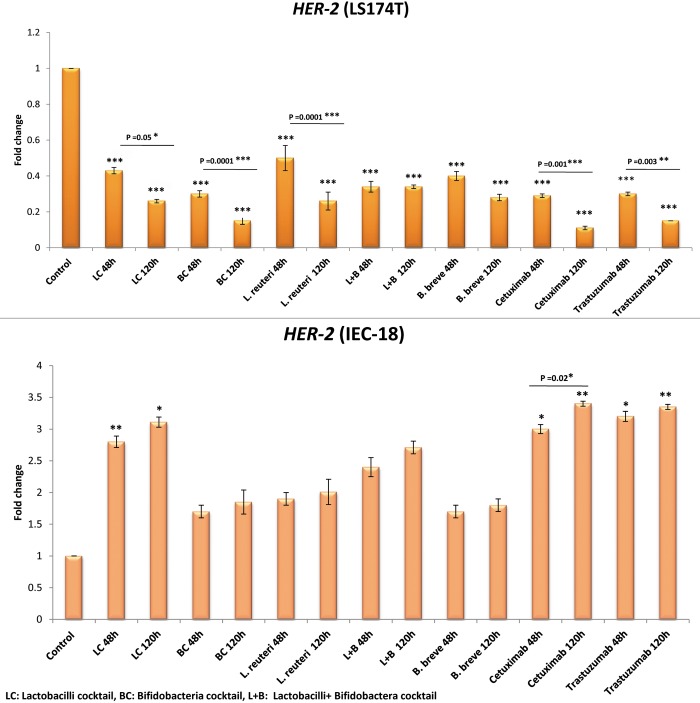
Fig 3. Relative fold change (relative to untreated control cells) of the HER-2 gene among LS174T and IEC-18 cells.
Results were expressed as mean; error bars (SD); n = 3. Statistical analysis was performed using one-way ANOVA test. * indicates P-values less than 0.05, ** indicates P-values less than 0.01, and *** indicates P-values less than 0.001. Untreated cells were used as negative controls and cetuximab and trastuzumab were used as positive controls.

