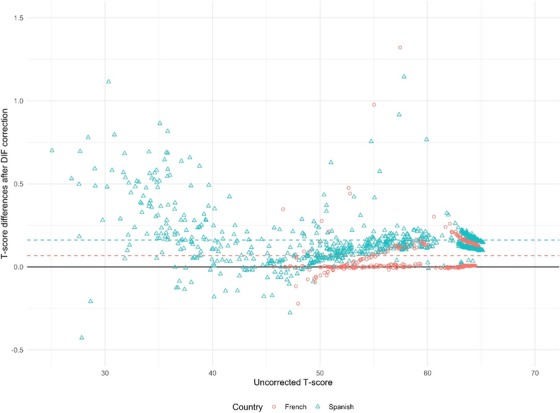
FIGURE 2.

Scatter plot showing the differences between initial (uncorrected) and DIF‐corrected T‐scores for the A‐IADL‐Q in the French (red) and Spanish (blue) groups, plotted against the uncorrected T‐scores. A dashed line is placed at the mean change in score in the French and Spanish groups. Difference in total score ranges from −0.5 to +1.5 on the T‐score, corresponding to approximately one tenth of a standard deviation difference. A solid black line is placed at no change. Abbreviations: A‐IADL‐Q, Amsterdam IADL Questionnaire; DIF, differential item functioning
