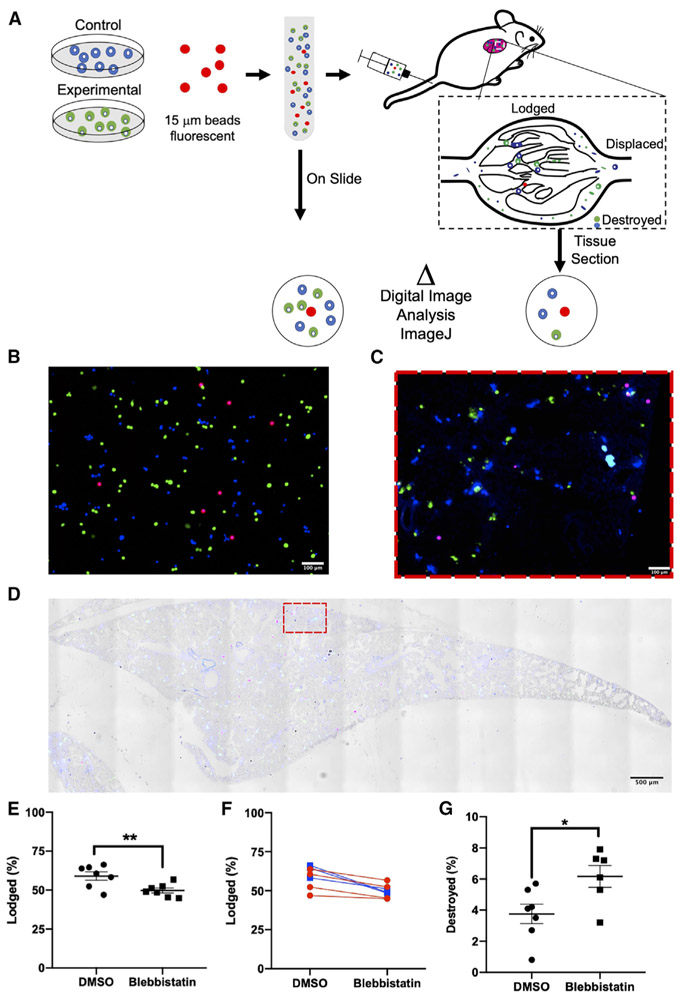
Figure 4. Myosin II Activity Is Required for the Lodgment of Intact CTCs in the Lung and Reduces Cellular Destruction Immediately following Entry into the Circulation.
(A) Schematic of the experiment, with DMSO control cells (shown in blue) and blebbistatin-treated cells (shown in green) mixed with microspheres labeled red prior to injection into mouse for assessment of lodgement in the lung.
(B) Cells treated with blebbistatin are pseudocolored green and cells treated with DMSO pseudocolored blue; beads are red. Representative image of uninjected control sample (“On Slide”). Scale bar, 100 μm.
(C and D) Micrograph of whole lung section (D) and magnified portion of the lung (C) with (D) and without (C) brightfield image overlay. Colors of cells and microspheres are as depected in (B). Scale bars, 100 μm (C) and 500 μm (D).
(E–G). Quantitation of effects of blebbistatin treatment on (E and F) lodgment of intact cells (**p < 0.01, n = 7, paired t test) and (G) cell destruction (*p < 0.05, n = 6 and 7, Welch’s t test). Graph of the lodgement data for each mouse, with the lines colored to group each dye condition (p > 0.05, two-way ANOVA, n = 7) (F).
Data in (E) and (G) are presented as mean with SEM error bars.

