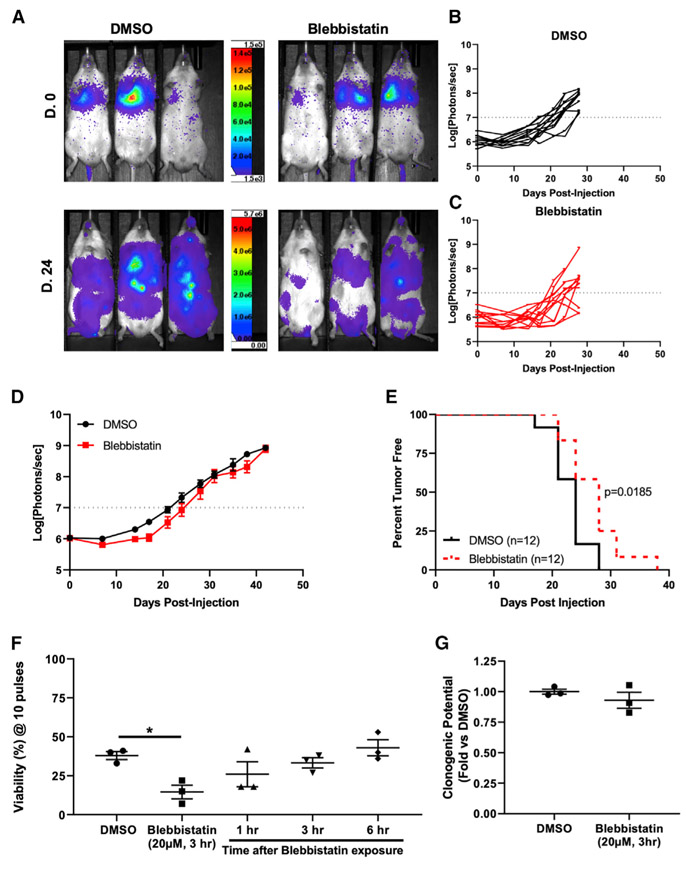
Figure 5. Pretreatment of Prostate Cancer Cells with Myosin II Inhibitor Delays Metastasis Formation.
(A) Representative bioluminescence images (BLIs) on the day of injection (D.0) and 24 days after injection (D.24) for groups injected with DMSO- and blebbistatin (20 μM, 3 h)-pretreated cells.
(B) Graph of BLI data for each mouse in the DMSO group (n = 12).
(C) Graph of individual mice in the blebbistatin group (n = 12).
(D) Graph of average tumor burden (photons/s) for the two groups (p < 0.05, two-way ANOVA).
(E) Kaplan-Meier curve of time to metastasis formation (photon/s > 107) (p = 0.0185, log rank test).
(F) Graph of viability after 10 pulses for GS689.Li cells pretreated with DMSO or blebbistatin (20 μM, 3 h) and exposed to FSS immediately or after a washout (*p < 0.05, one-way ANOVA with Bonferroni correction).
(G) Clonogenic potential of GS689.Li cells pretreated with blebbistatin or DMSO (p > 0.05, n = 3). Data in (D), (F), and (G) are presented as mean with SEM error bars.

