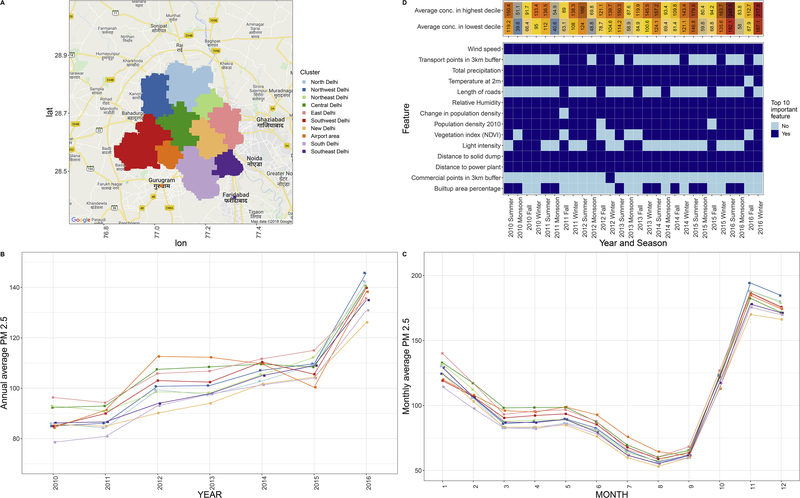
Fig 4. Geographical differences in pollution and distinguish features.
(A) Ten spatial clusters within the state of Delhi obtained using distance based hierarchical clustering. (B) Annual average PM2.5 concentrations at the ten spatial clusters from 2010 to 2016. (C) Monthly average PM2.5 concentrations at the ten spatial clusters. Averages concentrations were computed by aggregating concentrations in all grids within particular regions across years or months. (D) Ten most important features that discriminate the grids associated with the top and bottom deciles of predicted ambient air pollution across seasons and years.

