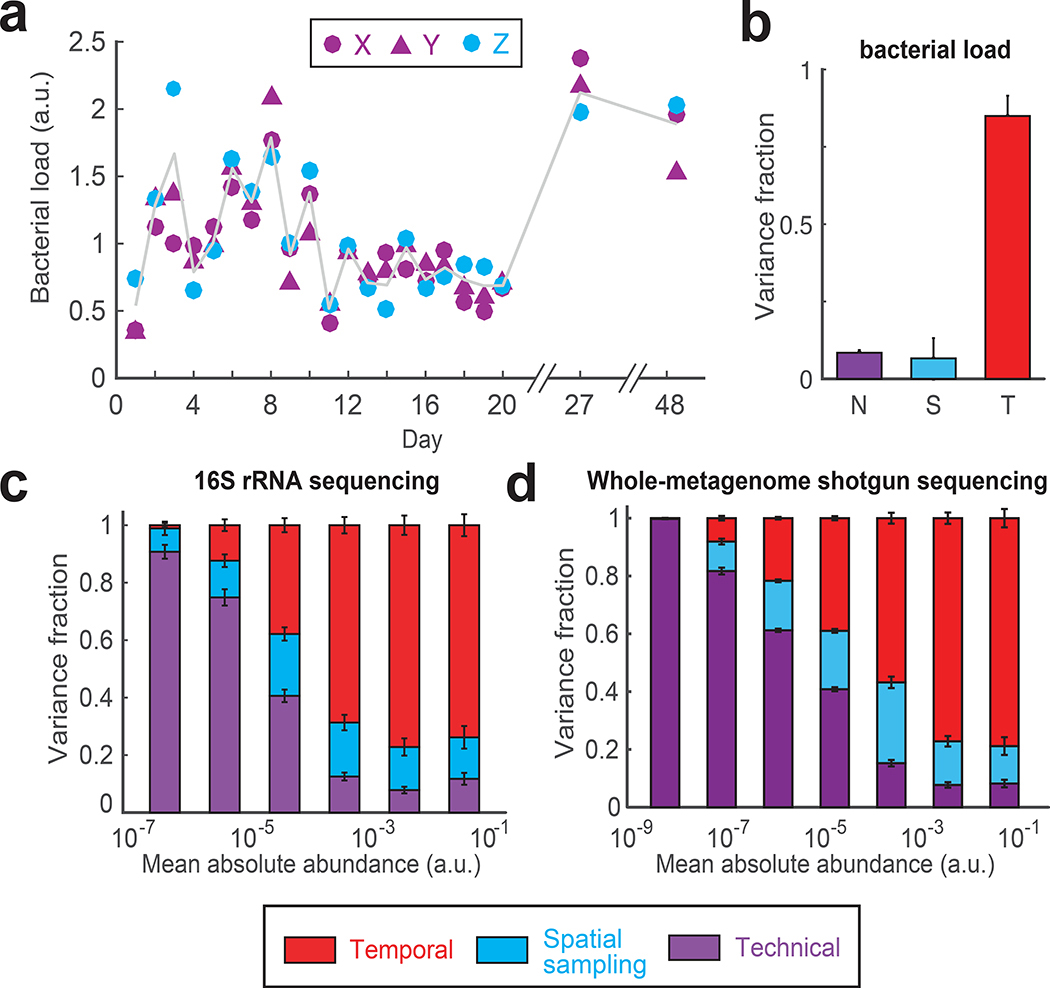
Figure 2 |. Variance decomposition of gut bacterial abundances using DIVERS.
(a) Temporal profiles of bacterial loads (∝ total bacterial DNA per mg of sample) in the human gut microbiome (for definition of X, Y and Z see Fig. 1a). Gray line shows the average of spatial replicates. Bacterial loads are reported in arbitrary units and normalized to a mean of one (Online Methods). (b) Variance fraction of the bacterial load attributed to technical (N, purple), spatial sampling (S, blue), and temporal (T, red) factors as calculated by the DIVERS variance decomposition model. The averages were computed using 1000 permutations of the X/Y/Z labels. Error bars represent SEM. (c) Variance decomposition of individual OTU abundances. Absolute OTU abundances were obtained by multiplying relative abundance profiles by the bacterial load in each sample and are reported in arbitrary units (Online Methods). n = 433 OTUs were binned by their mean abundance across all samples, and stacked bars show the average variance contribution of technical, spatial sampling, and temporal sources to OTUs within each bin. Error bars represent the standard error of the mean (SEM). (d) Variance decomposition for n = 3619 individual bacterial species based on species abundances obtained by shotgun metagenomic sequencing and species profiling with Kraken28 (Online Methods).

