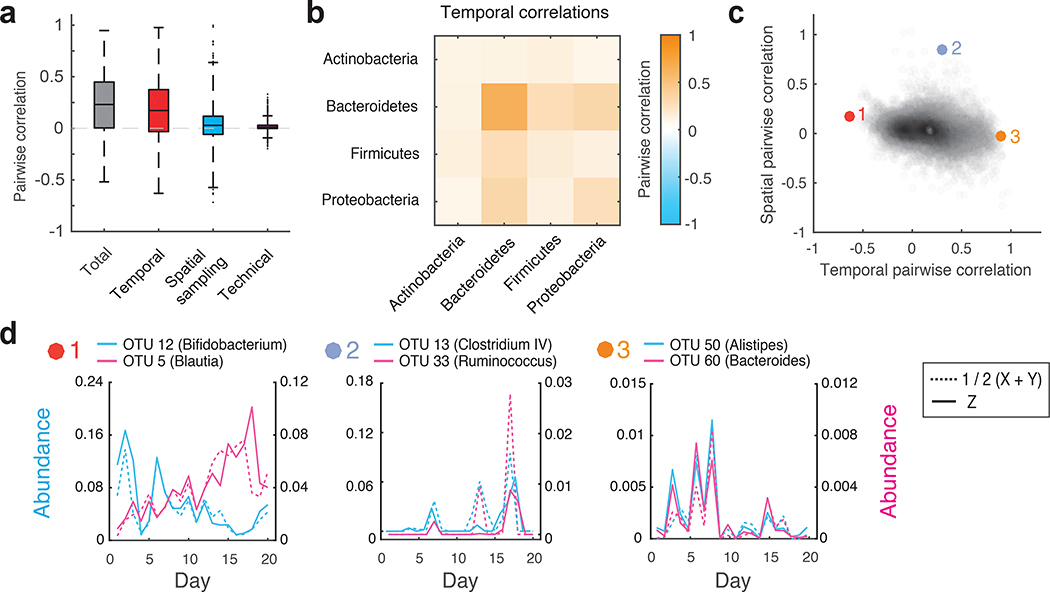
Figure 4 |. Decomposition of contributions to pairwise OTU abundance correlations in the human gut microbiome.
(a) Boxplots of total, temporal, spatial, and technical correlations for all pairs of abundant OTUs (average absolute abundance > 10−4). Boxes denote the median and interquartile ranges, with maximum whisker lengths three times the interquartile range. (b) Temporal correlations of OTU abundances within and between different phyla; colors reflect average temporal correlations between pairs of OTUs from the indicated phyla. Data are shown for all highly abundant OTUs (mean absolute abundance >10−4) from the Actinobacteria (n = 10), Bacteroidetes (n=15), Firmicutes (n=103), and Proteobacteria (n=5). (c) Temporal and spatial correlations for all pairs of abundant OTUs (average absolute abundance > 10−4). Colored points (1–3) indicate pairs of OTUs with temporal profiles shown in d. (d) Temporal abundance profiles for pairs of OTUs highlighted in c. Pairs exhibit (from left to right): 1) Substantial negative temporal (ρT = −0.63, p = 4×10⁻⁴), 2) substantial positive spatial (ρS = 0.85, p = 3×10⁻⁴), and 3) substantial positive temporal (ρT = 0.90, p < 10−4) correlations. For every OTU pair, blue and pink solid lines show abundances of each OTU measured from the same spatial location (Z). Blue and pink dashed lines show the average between technical replicates (1/2(X+Y)) of each OTU measured from the second spatial location. See online methods Eq. 9 for definition of the temporal correlation; p values were estimated by generating 104 random abundance series for the pairs of OTUs with known temporal variances, and then using these time series to compute the temporal covariances.

