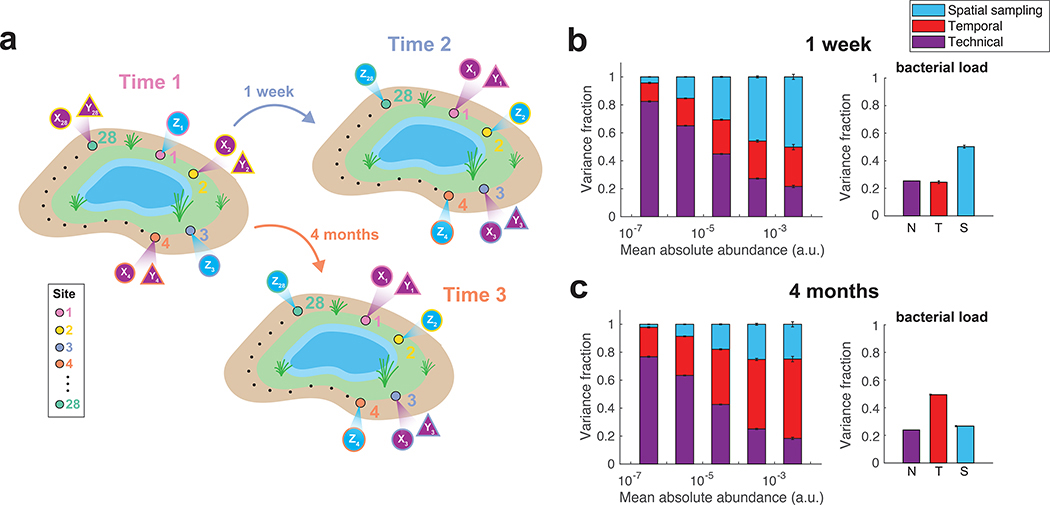
Figure 5 |. Decomposition of contributions to the variance of soil bacterial abundances.
(a) Illustration of the DIVERS sampling protocol applied to a Central Park soil microbial community. Samples were collected one week and four months apart from twenty-eight spatial sites spread uniformly around a small pond in the northwest area of the park. At each site i, two technical replicates were collected using samples from one time point (Xi and Yi), whereas a single measurement was made at the other time point (Zi) (b,c) DIVERS variance decomposition of n = 24667 individual OTU abundances (left panels) and n = 27 bacterial loads (right panels). Left panels: OTUs were binned by their mean abundance across all samples, and stacked bars show the average variance contribution of technical, spatial sampling, and temporal sources to OTUs within each bin. Right panels: variance contribution of technical, spatial sampling, and temporal sources to bacterial load. Error bars represent the SEM. Temporal variability reflects average changes in the community at the two time scales (1 week in b, 4 months in c).

